signal strength 2 of 5
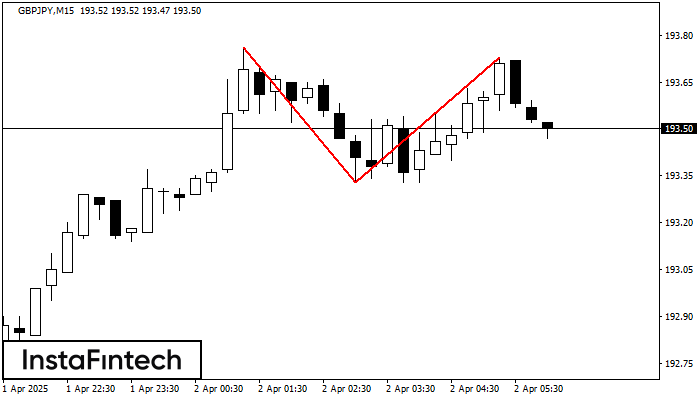
The Double Top pattern has been formed on GBPJPY M15. It signals that the trend has been changed from upwards to downwards. Probably, if the base of the pattern 193.33 is broken, the downward movement will continue.
The M5 and M15 time frames may have more false entry points.
انظر أيضا
- All
- Double Top
- Flag
- Head and Shoulders
- Pennant
- Rectangle
- Triangle
- Triple top
- All
- #AAPL
- #AMZN
- #Bitcoin
- #EBAY
- #FB
- #GOOG
- #INTC
- #KO
- #MA
- #MCD
- #MSFT
- #NTDOY
- #PEP
- #TSLA
- #TWTR
- AUDCAD
- AUDCHF
- AUDJPY
- AUDUSD
- EURCAD
- EURCHF
- EURGBP
- EURJPY
- EURNZD
- EURRUB
- EURUSD
- GBPAUD
- GBPCHF
- GBPJPY
- GBPUSD
- GOLD
- NZDCAD
- NZDCHF
- NZDJPY
- NZDUSD
- SILVER
- USDCAD
- USDCHF
- USDJPY
- USDRUB
- All
- M5
- M15
- M30
- H1
- D1
- All
- Buy
- Sale
- All
- 1
- 2
- 3
- 4
- 5
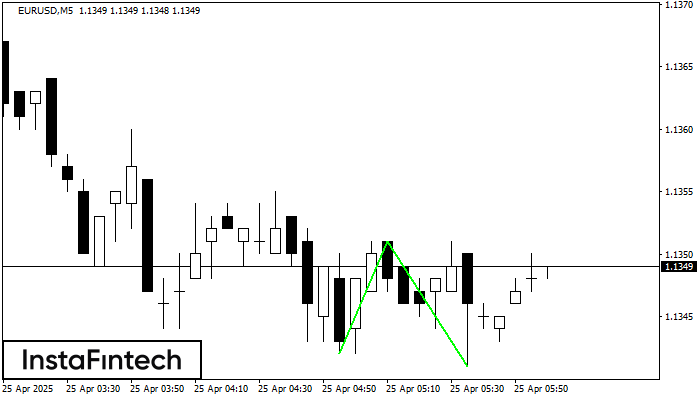
The Double Bottom pattern has been formed on EURUSD M5. Characteristics: the support level 1.1342; the resistance level 1.1351; the width of the pattern 9 points. If the resistance level
The M5 and M15 time frames may have more false entry points.
Открыть график инструмента в новом окне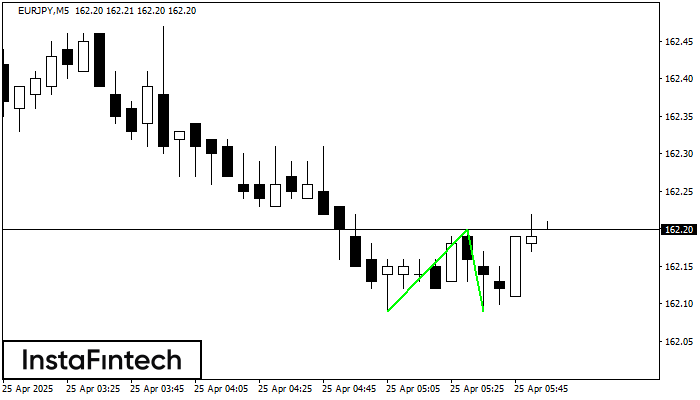
The Double Bottom pattern has been formed on EURJPY M5. Characteristics: the support level 162.09; the resistance level 162.20; the width of the pattern 11 points. If the resistance level
The M5 and M15 time frames may have more false entry points.
Открыть график инструмента в новом окне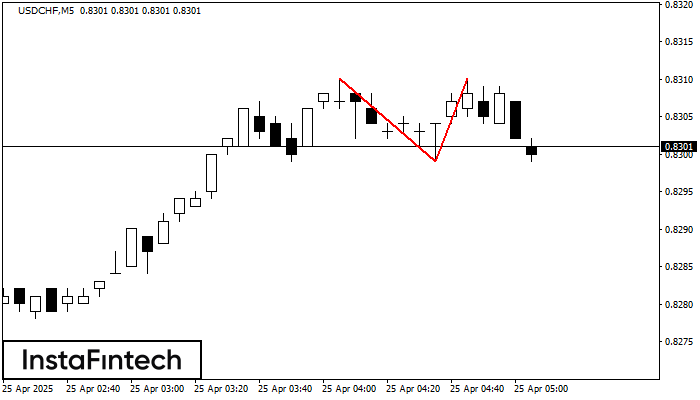
The Double Top reversal pattern has been formed on USDCHF M5. Characteristics: the upper boundary 0.8310; the lower boundary 0.8299; the width of the pattern is 11 points. Sell trades
The M5 and M15 time frames may have more false entry points.
Открыть график инструмента в новом окне