empty
 
 
27.12.2024 04:01 AM
Trading Recommendations and Review of EUR/USD on December 27; Total flat

EUR/USD 5-Minute Analysis

This image is no longer relevant

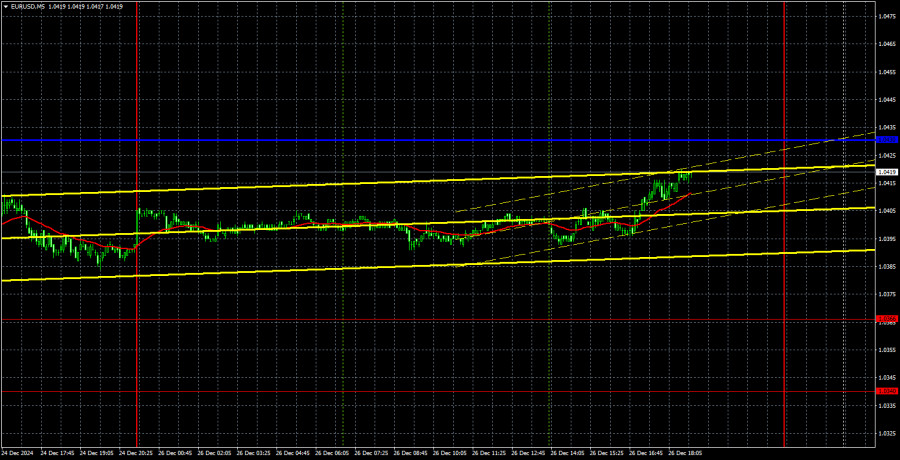
The EUR/USD currency pair showed no significant movement on Thursday. Throughout the day, the market exhibited a completely sideways trend with low volatility. As previously mentioned, trading during holidays is not ideal, even if some market activity takes place. Currently, there is virtually no activity—no fundamental events or macroeconomic releases. Many market participants have postponed trading until the new year. Even if there are some movements in the final days of the year, predicting them will be extremely challenging.

We believe that trading during this period should focus on a medium-term perspective. Since we expect the euro to continue its decline, traders might consider short positions on the 4-hour timeframe as long as the price remains below the moving average. However, trading on the hourly and 5-minute timeframes currently lacks significance. We are not even updating the Ichimoku indicator lines because there is no meaningful movement to track.

No trading signals were formed on Wednesday, as the price did not approach any key lines or levels.

COT Report

This image is no longer relevant

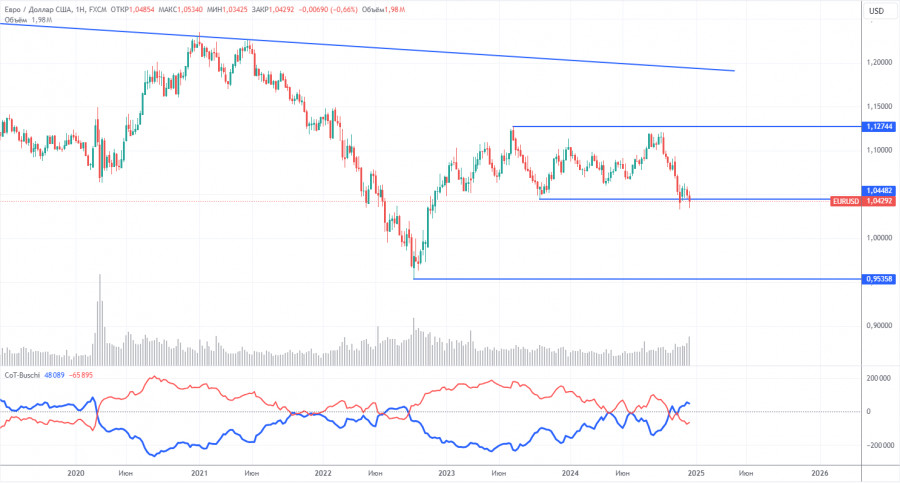
The latest Commitment of Traders (COT) report, dated December 17, shows a clear trend. The net position of non-commercial traders has remained bullish for a long time, but bears have gained the upper hand. Two months ago, the number of open short positions by professional traders surged, causing the net position to turn negative for the first time. This indicates that the euro is now sold more often than bought.

We continue to see no fundamental factors supporting the euro's growth, and technical analysis points to price consolidation — essentially, a flat market. On the weekly timeframe, it is evident that since December 2022, the pair has been trading within the 1.0448–1.1274 range. Therefore, further declines remain more likely. A break below 1.0448 would open new opportunities for a deeper fall.

The red and blue lines on the COT chart have crossed and changed their relative positions, signaling a bearish market trend. During the latest reporting week, the number of longs in the Non-commercial group decreased by 4,700, while shorts decreased by 14,400. As a result, the net position increased by almost 10,000, but this does not alter the overall bearish trend.

EUR/USD 1-Hour Analysis

This image is no longer relevant

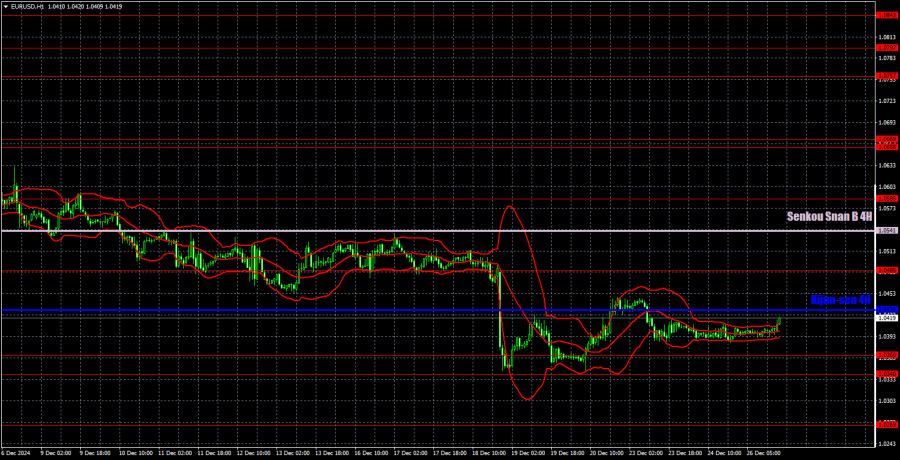
On the hourly timeframe, the currency pair has completed a three-week correction and has now resumed its downward movement. We anticipate that this decline may continue even during the holiday season, given the Federal Reserve's highly hawkish stance. The Fed is expected to lower rates only 1-2 times in 2025, which is much more hawkish than what the market currently anticipates. We believe there are no strong reasons for a significant rise in the euro. Additionally, the euro is approaching the 1.0340–1.0366 range for the fourth time. While holiday trading may result in a flat market, this is the scenario we are currently observing.

On December 27, we identify the following key trading levels: 1.0195, 1.0269, 1.0340-1.0366, 1.0485, 1.0585, 1.0658-1.0669, 1.0757, 1.0797, 1.0843, and 1.0889. Also, keep an eye on the Senkou Span B at 1.0541 and the Kijun-sen at 1.0430, as these Ichimoku lines may shift throughout the day, impacting trading signals. Make sure to set a Stop Loss at breakeven if the price moves 15 pips in your favor. This strategy helps minimize potential losses if the trade does not go as expected.

No major events are scheduled in the EU or US on Friday. Volatility is unlikely to increase, and market movements may remain limited. However, given the "thin" market conditions, sudden fluctuations could still occur.

Illustration Explanations:

Support and Resistance Levels (thick red lines): Key areas where price movement might stall. Not sources of trading signals.

Kijun-sen and Senkou Span B Lines: Ichimoku indicator lines transferred from the H4 timeframe to the hourly chart, serving as strong levels.

Extreme Levels (thin red lines): Points where the price has previously rebounded. They can serve as trading signal sources.

Yellow Lines: Trendlines, channels, or other technical patterns.

Indicator 1 on COT Charts: Reflects the net position size of each trader category.

Paolo Greco,
Analytical expert of InstaForex
© 2007-2025
Earn on cryptocurrency rate changes with InstaForex
Download MetaTrader 4 and open your first trade
  • Grand Choice
    Contest by
    InstaForex
    InstaForex always strives to help you
    fulfill your biggest dreams.
    JOIN CONTEST
  • Chancy Deposit
    Deposit your account with $3,000 and get $10000 more!
    In January we raffle $10000 within the Chancy Deposit campaign!
    Get a chance to win by depositing $3,000 to a trading account. Having fulfilled this condition, you become a campaign participant.
    JOIN CONTEST
  • Trade Wise, Win Device
    Top up your account with at least $500, sign up for the contest, and get a chance to win mobile devices.
    JOIN CONTEST
  • 100% Bonus
    Your unique opportunity to get a 100% bonus on your deposit
    GET BONUS
  • 55% Bonus
    Apply for a 55% bonus on your every deposit
    GET BONUS
  • 30% Bonus
    Receive a 30% bonus every time you top up your account
    GET BONUS

Recommended Stories

Can't speak right now?
Ask your question in the chat.
Widget callback