empty
22.10.2024 05:31 AM
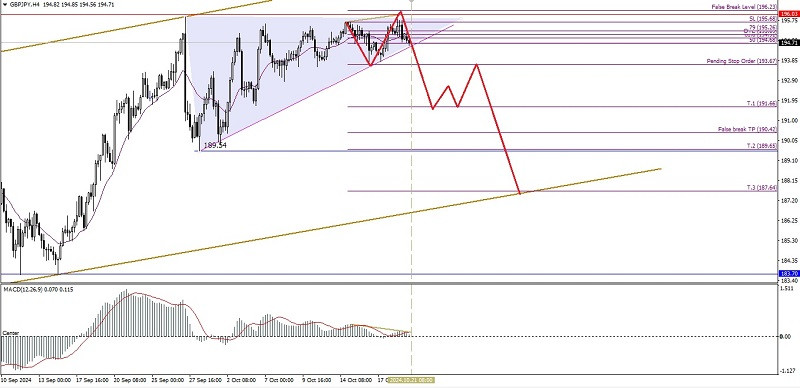
Technical Analysis of Intraday Price Movement of GBP/JPY Cross Currency Pairs, Monday October 21, 2024.

This image is no longer relevant

From what is seen on the 4-hour chart of the GBP/JPY cross currency pair, it appears that the price movement of the currency pair is in a Sideways condition where this is confirmed by the movement of its MA which is in the middle of its Candle body, but with the emergence of deviations between the GBP/JPY price movement and the MACD indicator, it gives an indication that in the near future GBP/JPY has the potential to weaken and fall where the level of 193.67 will be tested in the near future if there is no significant strengthening correction, especially until it breaks through and closes above the level of 196.03 and if GBP/JPY manages to break through and close below the level of 193.67, then GBP/JPY has the potential to continue its weakening to the level of 191.66 as its main target and 189.54 as the next target if momentum and volatility support it.

(Disclaimer)

Select timeframe
5
min
15
min
30
min
1
hour
4
hours
1
day
1
week
Earn on cryptocurrency rate changes with InstaForex
Download MetaTrader 4 and open your first trade
  • Grand Choice
    Contest by
    InstaForex
    InstaForex always strives to help you
    fulfill your biggest dreams.
    JOIN CONTEST

Recommended Stories

EUR/USD and GBP/USD – Technical Analysis for April 9

The bulls are attempting to regain control, and we are currently observing increased activity and a push toward the peak of the ongoing correction at 1.1147. A breakout above this

Evangelos Poulakis 10:07 2025-04-09 UTC+2

Technical Analysis of Intraday Price Movement Natural Gas Commodity Instrument, Wednesday, April 09, 2025.

On the 4-hour chart of the Natural Gas commodity instrument, a Bearish 123 pattern appears followed by a Bearish Ross Hook (RH) followed by a Natural Gas price movement below

Arief Makmur 07:11 2025-04-09 UTC+2

Technical Analysis of Intraday Price Movement of USD/CAD Commodity Currency Pair, Wednesday, April 09, 2025.

Although on the 4-hour chart the USD/CAD commodity currency pair is moving in a Bearish channel, but with the formation of a Bullish 123 pattern and being above

Arief Makmur 07:11 2025-04-09 UTC+2

EUR/USD Forecast for April 9, 2025

By the end of Tuesday, the euro gained 45 pips, and during today's Pacific session, it has added roughly the same amount, approaching the target level of 1.1027. If resistance

Laurie Bailey 04:31 2025-04-09 UTC+2

GBP/USD Forecast for April 9, 2025

On Tuesday, the British pound tested the lower boundary of the target range at 1.2816/47 with an upper shadow. This morning, the price managed to move inside this range

Laurie Bailey 04:31 2025-04-09 UTC+2

AUD/USD Forecast for April 9, 2025

The Australian dollar's attempts to rise on Monday and Tuesday towards the target level of 0.6133 were halted (as indicated by long upper shadows), but the pair is still pursuing

Laurie Bailey 04:31 2025-04-09 UTC+2

Trading Signals for GOLD (XAU/USD) for April 8-10, 2025: buy above $2,993 (200 EMA - rebound)

Our trading plan for the coming hours is to sell gold below 3,020, as technically there is a bearish trend channel. If gold fails to break above this level

Dimitrios Zappas 14:56 2025-04-08 UTC+2

Trading Signals for EUR/USD for April 8-10, 2025: sell below 1.0986 (200 EMA - 6/8 Murray)

If the euro breaks the downtrend channel, we could expect a new upward movement that could push EUR/USD up to 1.1051, last week's high, the 7/8 Murray at 1.1115

Dimitrios Zappas 14:54 2025-04-08 UTC+2

Forecast for EUR/USD on April 8, 2025

On Monday, the EUR/USD pair made two rebounds from the 76.4% retracement level, turned in favor of the euro, and consolidated above the 1.0944–1.0957 zone. As a result, the upward

Samir Klishi 10:57 2025-04-08 UTC+2

Forecast for GBP/USD on April 8, 2025

On the hourly chart, the GBP/USD pair continued its decline on Monday and ended the day near the 1.2709 level. Over just two trading days, the pound dropped by roughly

Samir Klishi 10:53 2025-04-08 UTC+2
Can't speak right now?
Ask your question in the chat.
Widget callback
 

Dear visitor,

Your IP address shows that you are currently located in the USA. If you are a resident of the United States, you are prohibited from using the services of InstaFintech Group including online trading, online transfers, deposit/withdrawal of funds, etc.

If you think you are seeing this message by mistake and your location is not the US, kindly proceed to the website. Otherwise, you must leave the website in order to comply with government restrictions.

Why does your IP address show your location as the USA?

  • - you are using a VPN provided by a hosting company based in the United States;
  • - your IP does not have proper WHOIS records;
  • - an error occurred in the WHOIS geolocation database.

Please confirm whether you are a US resident or not by clicking the relevant button below. If you choose the wrong option, being a US resident, you will not be able to open an account with InstaForex anyway.

We are sorry for any inconvenience caused by this message.