empty
08.10.2024 04:51 AM
Forecast for USD/JPY on October 8, 2024

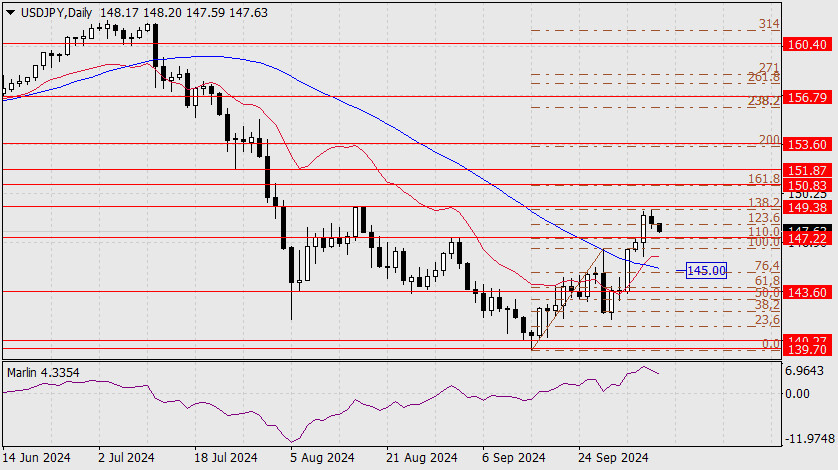
On Monday, the yen fell slightly short of reaching the target 149.38 (the August 15 peak) but accurately tested the 138.2% Fibonacci reaction level on the daily chart.

This image is no longer relevant

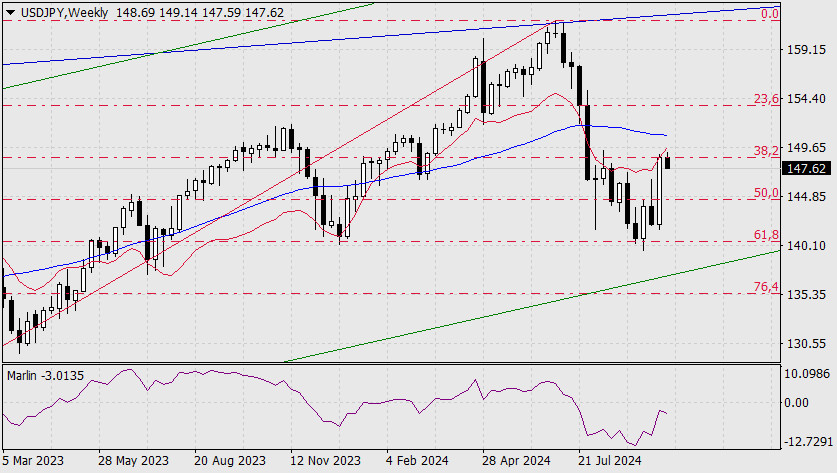
On the weekly chart, the price also worked through the 38.2% Fibonacci level at its intersection with the balance line. A price reversal is highly likely.

This image is no longer relevant

Thus, after the price consolidates below the 147.22 level, the target will open at the MACD line on the daily chart near the 76.4% Fibonacci level. The Marlin oscillator on the daily chart is turning around.

This image is no longer relevant

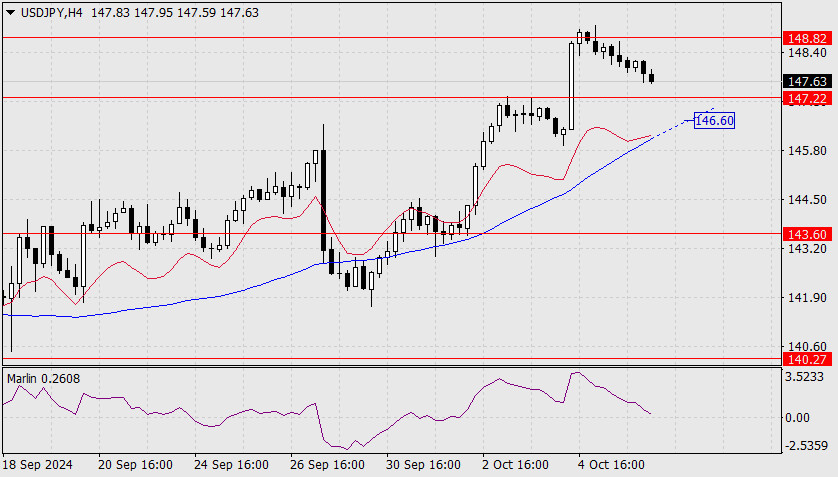
On the four-hour chart, the price slowly approaches the support at 147.22, with the Marlin oscillator approaching the border of the downtrend zone. After breaking the support and then the MACD line (146.60), the price will reach 145.00.

Laurie Bailey,
Analytical expert of InstaForex
© 2007-2025
Select timeframe
5
min
15
min
30
min
1
hour
4
hours
1
day
1
week
Earn on cryptocurrency rate changes with InstaForex
Download MetaTrader 4 and open your first trade
  • Trade Wise, Win Device
    Top up your account with at least $500, sign up for the contest, and get a chance to win mobile devices.
    JOIN CONTEST

Recommended Stories

Forecast for EUR/USD on January 9, 2025

On Wednesday, the EUR/USD pair consolidated below the support zone of 1.0336–1.0346 and continued its decline towards the 127.2% Fibonacci corrective level at 1.0255. A rebound from this level

Samir Klishi 11:21 2025-01-09 UTC+2

Forecast for GBP/USD on January 9, 2025

On the hourly chart, the GBP/USD pair executed a minor rebound from the 1.2488–1.2508 zone on Wednesday and continued its decline. By the end of the day, it consolidated below

Samir Klishi 11:16 2025-01-09 UTC+2

Technical Analysis of Daily Price Movement of S&P 500, Thursday January 09, 2025.

If we look at the daily chart of the S&P 500 index, it appears that #SPX is in a channel that is diving up, which means

Arief Makmur 06:21 2025-01-09 UTC+2

Technical Analysis of Intraday Price Movement of Crude Oil Commodity Asset, Thursday January 09, 2025.

From what we can see on the 4-hour chart of the Crude Oil commodity asset, it appears that #CL is currently being corrected to weaken from the previous strengthening movement

Arief Makmur 06:18 2025-01-09 UTC+2

Forecast for EUR/USD on January 9, 2025

Yesterday, the euro consolidated below the 1.0350 level, and during the Pacific session, it continued to decline slowly. The Marlin oscillator on the daily timeframe is also gradually moving downward

Laurie Bailey 04:25 2025-01-09 UTC+2

Forecast for GBP/USD on January 9, 2025

The British pound dropped more than 100 pips yesterday. Although the price approached the target level of 1.2294, the low from April 22, 2024, it did not reach

Laurie Bailey 04:09 2025-01-09 UTC+2

Forecast for AUD/USD on January 9, 2025

The Australian dollar has given up efforts to test the upper boundary of the descending price channel on the daily chart. This price weakness is also reflected in the downward

Laurie Bailey 04:09 2025-01-09 UTC+2

Trading Signals for EUR/USD for January 8-10, 2025: buy above 1.0253 (4/8 Murray - 21 SMA)

Technically, the euro is under bearish pressure. So, we believe that in case there is a technical bounce and the price consolidates below 1.0347 (21 SMA), it will be seen

Dimitrios Zappas 15:55 2025-01-08 UTC+2

Trading Signals for GOLD (XAU/USD) for January 8-10, 2025: buy above, $2,642 (21 SMA - 200 EMA)

If gold bounces around 2,642 in the next few hours and consolidates above this area, it will be seen as an opportunity to buy and the price could return

Dimitrios Zappas 13:56 2025-01-08 UTC+2

Forecast for EUR/USD on January 8, 2025

On Tuesday, the EUR/USD pair made a second reversal in favor of the U.S. dollar above the 1.0405–1.0420 zone and dropped to the support zone of 1.0336–1.0346. A rebound from

Samir Klishi 11:31 2025-01-08 UTC+2
Can't speak right now?
Ask your question in the chat.
Widget callback
 

Dear visitor,

Your IP address shows that you are currently located in the USA. If you are a resident of the United States, you are prohibited from using the services of InstaFintech Group including online trading, online transfers, deposit/withdrawal of funds, etc.

If you think you are seeing this message by mistake and your location is not the US, kindly proceed to the website. Otherwise, you must leave the website in order to comply with government restrictions.

Why does your IP address show your location as the USA?

  • - you are using a VPN provided by a hosting company based in the United States;
  • - your IP does not have proper WHOIS records;
  • - an error occurred in the WHOIS geolocation database.

Please confirm whether you are a US resident or not by clicking the relevant button below. If you choose the wrong option, being a US resident, you will not be able to open an account with InstaForex anyway.

We are sorry for any inconvenience caused by this message.