empty
14.03.2025 04:00 PM
EUR/USD: Trading Plan for the U.S. Session on March 14th (Review of Morning Trades)

In my morning forecast, I focused on the 1.0852 level and planned to base my trading decisions on it. Let's examine the 5-minute chart to see what happened. A rise followed by a false breakout at 1.0852 provided an excellent short entry point, but the pair failed to experience a significant decline. The technical outlook has been revised for the second half of the day.

This image is no longer relevant

To Open Long Positions on EUR/USD:

Inflation data from Germany and France came in exactly as expected, leading to a modest strengthening of the euro in the first half of the day. During the U.S. session, a strong return in demand for the U.S. dollar is unlikely, so it is preferable to trade in favor of EUR/USD's upward movement.

The University of Michigan Consumer Sentiment Index and inflation expectations may trigger volatility but are unlikely to change the market trend. The main task for bulls in the second half of the day will be to defend the new support at 1.0886. A false breakout at this level will be an opportunity to buy EUR/USD, anticipating a further bullish move toward 1.0945, the upper boundary of the sideways channel.

A break and retest of this range from above will confirm a strong buy entry, with an upward target of 1.0997. The ultimate target will be the 1.1047 high, where I plan to take profits.

If EUR/USD declines and fails to attract buyers around 1.0886, the pair will remain within the channel, possibly leading to a minor correction. In this case, sellers may push the pair toward 1.0827. I will only consider buying after a false breakout at this level. If the pair drops further, I will open long positions on a rebound from 1.0770, targeting a 30-35 point intraday upward correction.

To Open Short Positions on EUR/USD:

Sellers remain inactive, making it unlikely that they will re-enter the market at the end of the week. For this reason, it is best not to rush into short positions and instead wait for a higher entry point. A false breakout around 1.0945 will provide a good opportunity to sell, targeting a correction toward support at 1.0886, just below the moving averages, which currently favor bulls.

A break and consolidation below this range would serve as another sell signal, pushing EUR/USD toward 1.0827. The final target for short positions will be 1.0770, where I will take profits.

If EUR/USD rises in the second half of the day and bears fail to act at 1.0945—which I doubt—buyers could trigger another major rally. In this case, I will postpone short positions until a test of the next resistance at 1.0997, where I will sell only after an unsuccessful breakout attempt. If there is no downward reaction, I will consider short positions on a rebound from 1.1047, aiming for a 30-35 point downward correction.

This image is no longer relevant

Commitments of Traders (COT) Report:

The COT report for March 4 showed an increase in long positions and a sharp reduction in short positions. More traders are willing to buy the euro, which has led to a significant strengthening of EUR/USD.

Germany's new fiscal stimulus measures have further boosted demand for the euro, and the ECB's cautious stance on future rate cuts has also supported EUR/USD, as reflected in the report. The previous slight advantage of euro sellers is no longer as influential, but caution is still needed when buying at current highs.

The COT report showed that long non-commercial positions increased by 2,524 to 185,223, while short non-commercial positions decreased by 12,795 to 195,329. As a result, the gap between long and short positions widened by 3,471.

This image is no longer relevant

Indicator Signals:

Moving Averages:

Trading is occurring near the 30-day and 50-day moving averages, indicating market uncertainty.

Note: The periods and prices of moving averages analyzed by the author are based on the H1 chart and differ from the standard daily moving averages on the D1 chart.
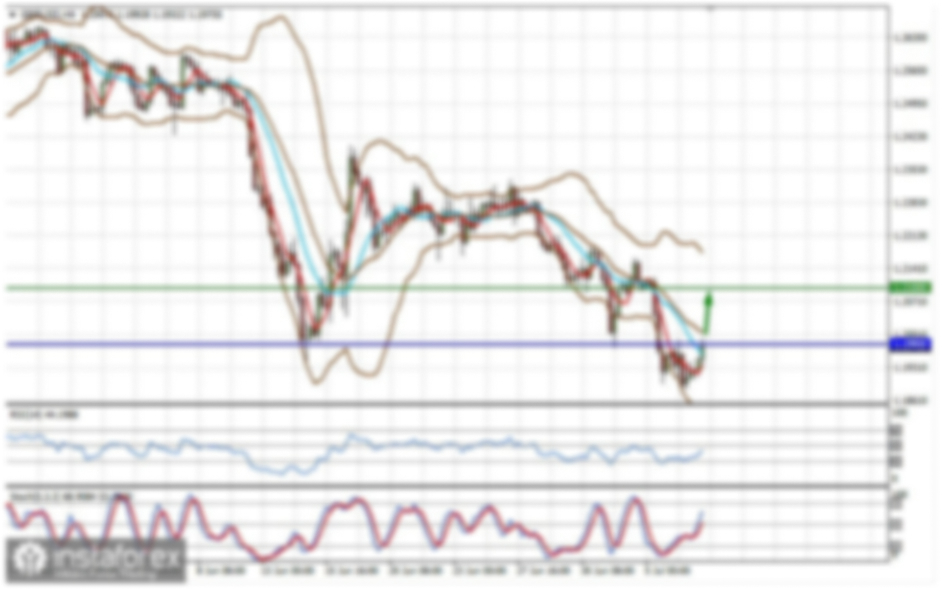
Bollinger Bands:

If EUR/USD declines, the lower boundary of the indicator around 1.0827 will act as support.

Indicator Descriptions:

  • Moving Average (MA): Identifies the current trend by smoothing out volatility and noise.
    • 50-period MA (yellow on the chart)
    • 30-period MA (green on the chart)
  • MACD (Moving Average Convergence/Divergence):
    • Fast EMA – 12-period
    • Slow EMA – 26-period
    • SMA – 9-period
  • Bollinger Bands: 20-period
  • Non-commercial traders: Speculators, including individual traders, hedge funds, and large institutions using the futures market for speculative purposes.
  • Long non-commercial positions: The total long open positions held by non-commercial traders.
  • Short non-commercial positions: The total short open positions held by non-commercial traders.
  • Net non-commercial position: The difference between short and long positions among non-commercial traders.
Miroslaw Bawulski,
Analytical expert of InstaForex
© 2007-2025
EURUSD
Euro vs US Dollar
Summary
Neutral
Urgency
1 day
Analytic
Maxim Magdalinin
Start trade
Earn on cryptocurrency rate changes with InstaForex
Download MetaTrader 4 and open your first trade
  • Grand Choice
    Contest by
    InstaForex
    InstaForex always strives to help you
    fulfill your biggest dreams.
    JOIN CONTEST

Recommended Stories

Trading Recommendations and Analysis for GBP/USD on March 21 — The British Pound Continues to Mock

The GBP/USD currency pair continued trading on Thursday... It's hard to say which direction to go in. The uptrend remains intact, but the price broke below the lower boundary

Paolo Greco 03:03 2025-03-21 UTC+2

Trading Recommendations and Analysis for EUR/USD on March 21 — A Chance for the Dollar?

On Thursday, the EUR/USD currency pair continued to frustrate traders. We believe this is not the best time to trade in the Forex market. The technical picture for the euro

Paolo Greco 03:03 2025-03-21 UTC+2

GBP/USD: Trading Plan for the U.S. Session on March 20th (Analysis of Morning Trades)

In my morning forecast, I focused on the 1.2983 level and planned to make trading decisions based on it. Looking at the 5-minute chart, we can analyze what happened

Miroslaw Bawulski 18:25 2025-03-20 UTC+2

EUR/USD: Trading Plan for the U.S. Session on March 20th (Analysis of Morning Trades)

In my morning forecast, I focused on the 1.0888 level and planned to use it as a decision point for entering the market. Let's look at the 5-minute chart

Miroslaw Bawulski 18:19 2025-03-20 UTC+2

How to Trade the GBP/USD Pair on March 20? Simple Tips and Trade Analysis for Beginners

Analysis of Wednesday's Trades 1H Chart of GBP/USD The GBP/USD pair continued its upward movement on Wednesday. After the Federal Reserve kept its key interest rate unchanged and downgraded U.S

Paolo Greco 06:47 2025-03-20 UTC+2

How to Trade the EUR/USD Pair on March 20? Simple Tips and Trade Analysis for Beginners

Analysis of Wednesday's Trades 1H Chart of EUR/USD The EUR/USD currency pair traded with a slight decline on Wednesday, which was purely coincidental, as the pound sterling also closed lower

Paolo Greco 06:47 2025-03-20 UTC+2

Trading Recommendations and Analysis for GBP/USD on March 20: Bank of England Meeting Ahead

The GBP/USD currency pair continued to trade within the same range on Wednesday. Despite the Fed meeting, Jerome Powell's speech, and the updated dot-plot, the market saw no significant movements

Paolo Greco 05:55 2025-03-20 UTC+2

Trading Recommendations and Analysis for EUR/USD on March 20: A Strange Fed Meeting

The EUR/USD currency pair traded on Wednesday the same way it had for the last two weeks. The Fed meeting had virtually no impact on market sentiment, although there

Paolo Greco 05:54 2025-03-20 UTC+2

GBP/USD: Trading Plan for the U.S. Session on March 19th (Review of Morning Trades)

In my morning forecast, I highlighted the 1.2980 level as a key area for making market entry decisions. Let's analyze the 5-minute chart to see what happened. A break

Miroslaw Bawulski 18:02 2025-03-19 UTC+2

EUR/USD: Trading Plan for the U.S. Session on March 19th (Review of Morning Trades)

In my morning forecast, I highlighted the 1.0906 level as a key point for making market entry decisions. Let's examine the 5-minute chart to see what happened. A break

Miroslaw Bawulski 17:59 2025-03-19 UTC+2
Can't speak right now?
Ask your question in the chat.
Widget callback
 

Dear visitor,

Your IP address shows that you are currently located in the USA. If you are a resident of the United States, you are prohibited from using the services of InstaFintech Group including online trading, online transfers, deposit/withdrawal of funds, etc.

If you think you are seeing this message by mistake and your location is not the US, kindly proceed to the website. Otherwise, you must leave the website in order to comply with government restrictions.

Why does your IP address show your location as the USA?

  • - you are using a VPN provided by a hosting company based in the United States;
  • - your IP does not have proper WHOIS records;
  • - an error occurred in the WHOIS geolocation database.

Please confirm whether you are a US resident or not by clicking the relevant button below. If you choose the wrong option, being a US resident, you will not be able to open an account with InstaForex anyway.

We are sorry for any inconvenience caused by this message.