signal strength 1 of 5
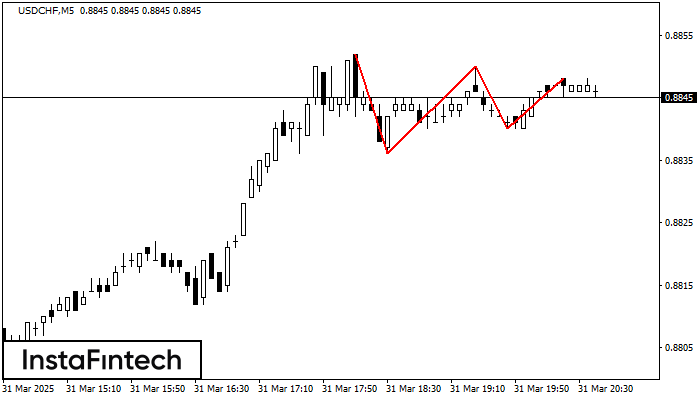
The Triple Top pattern has formed on the chart of the USDCHF M5 trading instrument. It is a reversal pattern featuring the following characteristics: resistance level 4, support level -4, and pattern’s width 16. Forecast If the price breaks through the support level 0.8836, it is likely to move further down to 0.8835.
The M5 and M15 time frames may have more false entry points.
See Also
- All
- Double Top
- Flag
- Head and Shoulders
- Pennant
- Rectangle
- Triangle
- Triple top
- All
- #AAPL
- #AMZN
- #Bitcoin
- #EBAY
- #FB
- #GOOG
- #INTC
- #KO
- #MA
- #MCD
- #MSFT
- #NTDOY
- #PEP
- #TSLA
- #TWTR
- AUDCAD
- AUDCHF
- AUDJPY
- AUDUSD
- EURCAD
- EURCHF
- EURGBP
- EURJPY
- EURNZD
- EURRUB
- EURUSD
- GBPAUD
- GBPCHF
- GBPJPY
- GBPUSD
- GOLD
- NZDCAD
- NZDCHF
- NZDJPY
- NZDUSD
- SILVER
- USDCAD
- USDCHF
- USDJPY
- USDRUB
- All
- M5
- M15
- M30
- H1
- D1
- All
- Buy
- Sale
- All
- 1
- 2
- 3
- 4
- 5
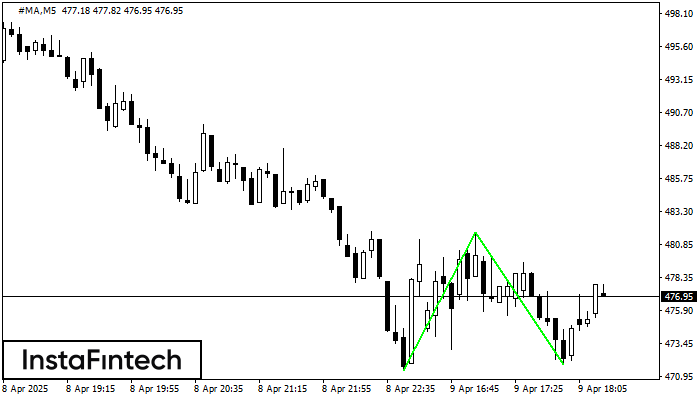
The Double Bottom pattern has been formed on #MA M5. Characteristics: the support level 471.47; the resistance level 481.71; the width of the pattern 1024 points. If the resistance level
The M5 and M15 time frames may have more false entry points.
Open chart in a new window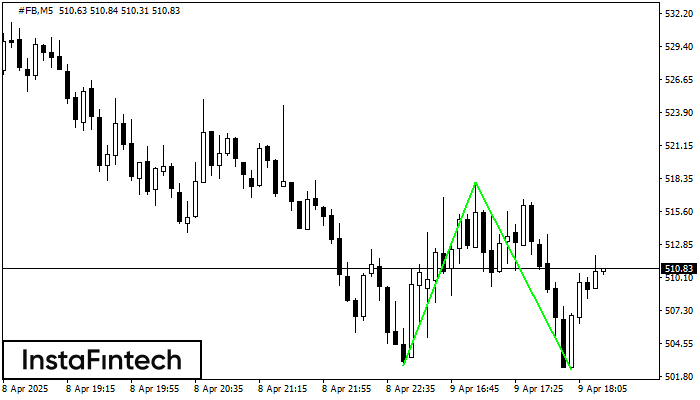
The Double Bottom pattern has been formed on #FB M5; the upper boundary is 518.05; the lower boundary is 502.39. The width of the pattern is 1532 points. In case
The M5 and M15 time frames may have more false entry points.
Open chart in a new window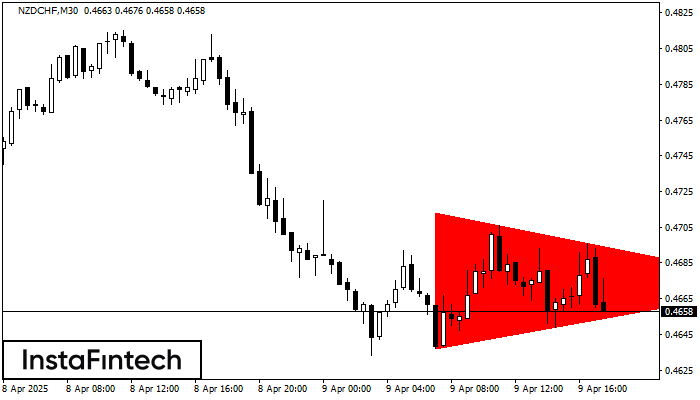
According to the chart of M30, NZDCHF formed the Bearish Symmetrical Triangle pattern. Description: The lower border is 0.4637/0.4673 and upper border is 0.4713/0.4673. The pattern width is measured
Open chart in a new window