empty
29.01.2025 04:54 AM
Forecast for Bitcoin on January 29, 2025

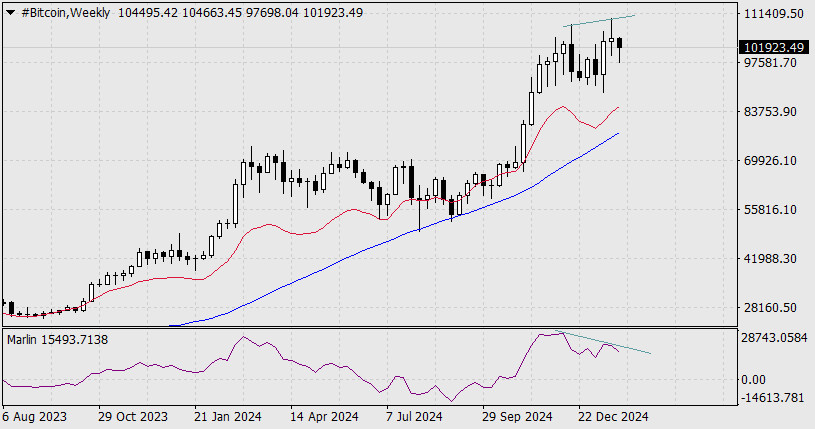
On the weekly chart, there is a clear divergence between the price and the Marlin oscillator. This divergence has significant potential; if it does not lead to a full reversal, it could at least result in a correction lasting 2 to 3 weeks.

This image is no longer relevant

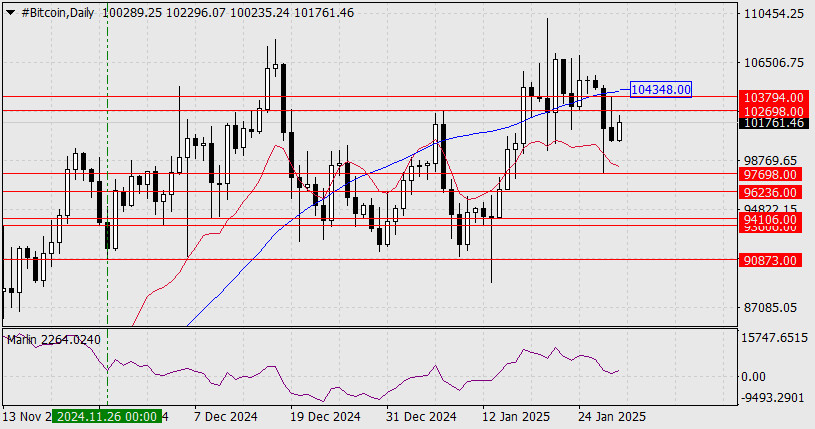
On the daily chart, the price has consolidated below the MACD line, and the Marlin oscillator is attempting to enter the downtrend territory. The projected targets for the decline are as follows: 97,698, 96,236, 93,606–94,106, and 90,873, which is the low from November 26.

This image is no longer relevant

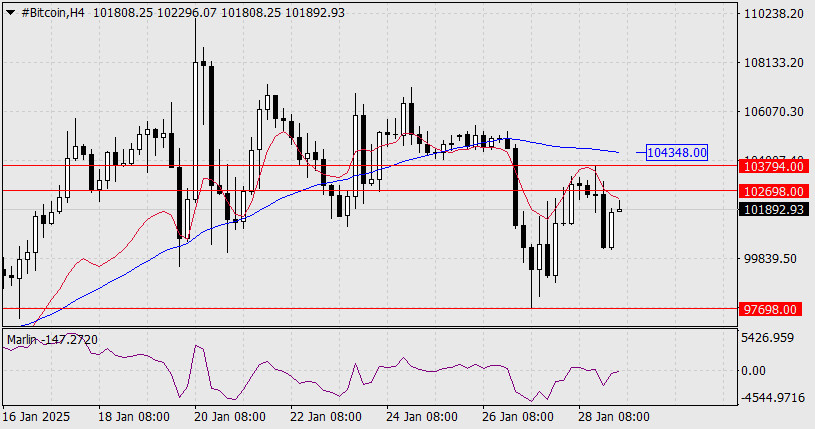
An upward movement could occur if the price breaks above the MACD line at around 104,348. On the four-hour chart, the price remains below the balance line (red moving average) and is holding below the 102,698 level, which is the high from January 7. The Marlin oscillator has solidified its position in the bearish zone.

This image is no longer relevant

The nearest targets for a decline in Bitcoin are 97,698 and 96,236. Conversely, an alternative upward scenario could develop if the price breaks above 103,794 and the MACD line at 104,348. It is worth noting that the MACD lines on the H4 and daily charts coincide, which further strengthens this resistance level.

Laurie Bailey,
InstaForex के विश्लेषणात्मक विशेषज्ञ
© 2007-2025
समय सीमा चुनें
5
मिनट
15
मिनट
30
मिनट
1
घंटा
4
घंटे
1
दिन
1
सप्ताह
Earn on cryptocurrency rate changes with InstaForex
Download MetaTrader 4 and open your first trade
  • चैन्सी डिपॉजिट
    $ 3,000 के साथ अपना खाता जमा करें और प्राप्त करें $1000 अधिक!
    में फ़रवरी हम आकर्षित करते हैं $1000 चैंसी डिपॉज़िट में
    ट्रेडिंग अकाउंट में $ 3,000 जमा करके जीतने का अवसर प्राप्त करें इस शर्त को पूरा करके आप प्रतियोगिता में भाग ले सकते हैं
    कॉन्टेस्ट में हिस्सा लें

अनुशंसित लेख

AUD/USD: जोड़ी में गिरावट का खतरा

**रिजर्व बैंक ऑफ़ ऑस्ट्रेलिया (RBA)**, रिजर्व बैंक ऑफ़ न्यूज़ीलैंड (RBNZ) की तरह, आर्थिक विकास को प्रोत्साहित करने की स्थिति बनाने के लिए अपनी **मौद्रिक नीति में सहजता** जारी रखे हुए

Pati Gani 10:30 2025-02-19 UTC+2

14-17 फरवरी, 2025 के लिए बिटकॉइन (BTC/USD) के लिए ट्रेडिंग सिग्नल: $96,569 से ऊपर खरीदें (21 SMA - 3/8 मुर्रे)

इसके विपरीत, यदि बिटकॉइन की कीमत $96,000 से नीचे गिरती है, तो मंदी का चक्र फिर से शुरू होने की उम्मीद है। इसलिए, यह 93,750 पर स्थित मरे के 2/8

Dimitrios Zappas 18:16 2025-02-14 UTC+2

GBP/USD – 13 फ़रवरी: ब्रिटिश पाउंड के लिए जश्न

प्रति घंटा चार्ट पर, GBP/USD जोड़ी ने बुधवार को अपनी ऊपर की ओर गति जारी रखी और गुरुवार को 1.2488–1.2508 के प्रतिरोध क्षेत्र तक पहुँच गई। इस क्षेत्र से अस्वीकृति

Samir Klishi 17:55 2025-02-13 UTC+2

नैस्डैक 100 इंडेक्स के दैनिक मूल्य आंदोलन का तकनीकी विश्लेषण, गुरुवार 13 फरवरी, 2025।

हालाँकि वर्तमान में अपने दैनिक चार्ट पर नैस्डैक 100 सूचकांक अभी भी ऊपर की ओर बढ़ रहा है, जहाँ इसकी पुष्टि इसके आंदोलन से होती है जो अभी भी बुलिश

Arief Makmur 17:55 2025-02-13 UTC+2

EUR/USD – 12 फरवरी: पावल ने FOMC की आक्रामक स्थिति की पुष्टि की

मंगलवार को, EUR/USD ने 23.6% फिबोनाच्ची रिट्रेसमेंट स्तर 1.0288 के आसपास यूरो के पक्ष में पलटाव किया और एक नया ऊपर की ओर आंदोलन शुरू किया। बुल्स ने इस जोड़ी

Samir Klishi 12:42 2025-02-12 UTC+2

12 फरवरी, 2025 के लिए बिटकॉइन पूर्वानुमान

दैनिक चार्ट पर, बिटकॉइन संतुलन संकेतक रेखा (लाल मूविंग एवरेज) के ऊपर टूटने में संघर्ष कर रहा है, जो यह संकेत करता है कि बाजार प्रतिभागी बेचने पर केंद्रित हैं।

Laurie Bailey 08:45 2025-02-12 UTC+2

GBP/USD – फरवरी 11: पावेल और बेली मंगलवार को बाजार की दिशा तय करेंगे

वेव संरचना स्पष्ट है। अंतिम पूरी हुई नीचे की ओर लहर ने पिछले निचले स्तर को नहीं तोड़ा। अंतिम पूरी हुई ऊपर की ओर लहर ने पिछले शिखर को पार

Samir Klishi 12:47 2025-02-11 UTC+2

EUR/USD – 11 फरवरी: ट्रंप ने एक नया खतरनाक खेल शुरू किया

सोमवार को, EUR/USD जोड़ी 1.0335 – 1.0346 प्रतिरोध क्षेत्र की ओर बढ़ी, लेकिन इसे अस्वीकार कर दिया गया और यह अमेरिकी डॉलर के पक्ष में पलट गई, जिससे यह 1.0288

Samir Klishi 12:39 2025-02-11 UTC+2

10 फरवरी, 2025 के लिए तेल का पूर्वानुमान

कच्चा तेल (CL) साप्ताहिक चार्ट पर, मूल्य केवल संक्षेप में MACD संकेतक रेखा के नीचे गिरा था, इसके बाद उसने पुनरुद्धार किया। नया ट्रेडिंग सप्ताह इस रेखा के ऊपर खुला

Laurie Bailey 12:09 2025-02-10 UTC+2

बिटकॉइन (BTC/USD) के लिए ट्रेडिंग संकेत (6-8 फरवरी, 2025): $100,300 (21 SMA - 8/8 मरे) के नीचे बेचें।

यदि बिटकॉइन की कीमत 100,500 के आसपास के क्षेत्र से नीचे गिरती है, तो इसे बेचने का संकेत माना जाएगा, जिसका लक्ष्य 93,750 होगा। अंततः, कीमत 85,810 तक गिर सकती

Dimitrios Zappas 10:32 2025-02-07 UTC+2
अभी बात नहीं कर सकते?
अपना प्रश्न पूछें बातचीत.
Widget callback
 

Dear visitor,

Your IP address shows that you are currently located in the USA. If you are a resident of the United States, you are prohibited from using the services of InstaFintech Group including online trading, online transfers, deposit/withdrawal of funds, etc.

If you think you are seeing this message by mistake and your location is not the US, kindly proceed to the website. Otherwise, you must leave the website in order to comply with government restrictions.

Why does your IP address show your location as the USA?

  • - you are using a VPN provided by a hosting company based in the United States;
  • - your IP does not have proper WHOIS records;
  • - an error occurred in the WHOIS geolocation database.

Please confirm whether you are a US resident or not by clicking the relevant button below. If you choose the wrong option, being a US resident, you will not be able to open an account with InstaForex anyway.

We are sorry for any inconvenience caused by this message.