


signal strength 1 of 5
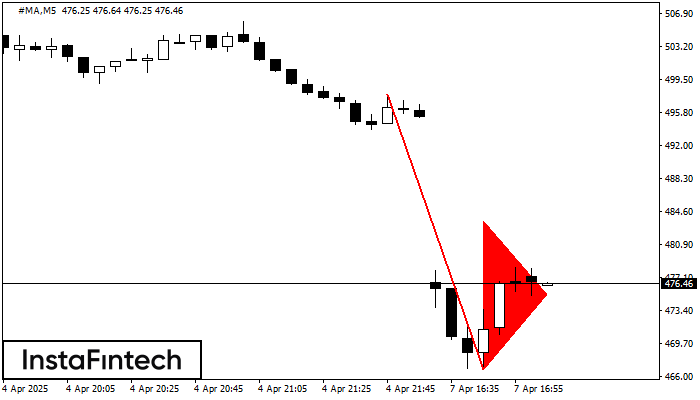
The Bearish pennant pattern has formed on the #MA M5 chart. It signals potential continuation of the existing trend. Specifications: the pattern’s bottom has the coordinate of 466.76; the projection of the flagpole height is equal to 3098 pips. In case the price breaks out the pattern’s bottom of 466.76, the downtrend is expected to continue for further level 466.61.
The M5 and M15 time frames may have more false entry points.
- All
- Double Top
- Flag
- Head and Shoulders
- Pennant
- Rectangle
- Triangle
- Triple top
- All
- #AAPL
- #AMZN
- #Bitcoin
- #EBAY
- #FB
- #GOOG
- #INTC
- #KO
- #MA
- #MCD
- #MSFT
- #NTDOY
- #PEP
- #TSLA
- #TWTR
- AUDCAD
- AUDCHF
- AUDJPY
- AUDUSD
- EURCAD
- EURCHF
- EURGBP
- EURJPY
- EURNZD
- EURRUB
- EURUSD
- GBPAUD
- GBPCHF
- GBPJPY
- GBPUSD
- GOLD
- NZDCAD
- NZDCHF
- NZDJPY
- NZDUSD
- SILVER
- USDCAD
- USDCHF
- USDJPY
- USDRUB
- All
- M5
- M15
- M30
- H1
- D1
- All
- Buy
- Sale
- All
- 1
- 2
- 3
- 4
- 5
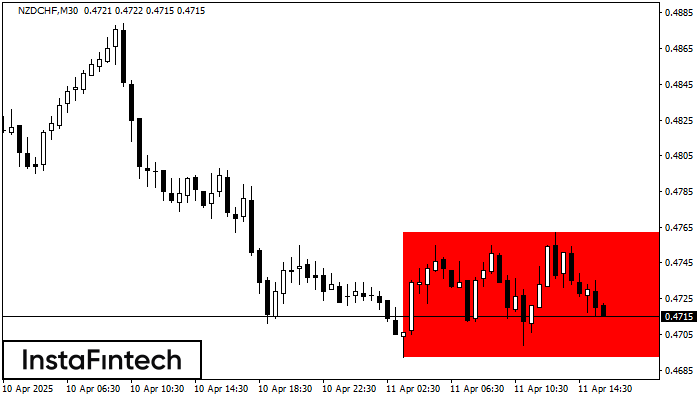
Berdasarkan carta M30, NZDCHF telah membentuk Segi Empat Menurun. Corak ini menunjukkan kesinambungan aliran. Sempadan atas adalah 0.4762, sempadan bawah adalah 0.4692. Isyarat bermakna bahawa kedudukan pendek perlu dibuka selepas
Open chart in a new window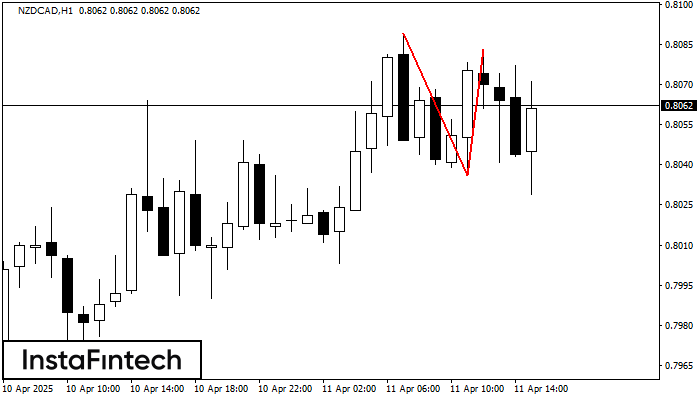
Pada carta NZDCAD H1 corak pembalikan Double Top telah terbentuk. Ciri-ciri: sempadan atas 0.8083; sempadan bawah 0.8036; lebar corak 47 mata. Isyarat: penembusan sempadan bawah akan menyebabkan kesinambungan arah aliran
Open chart in a new window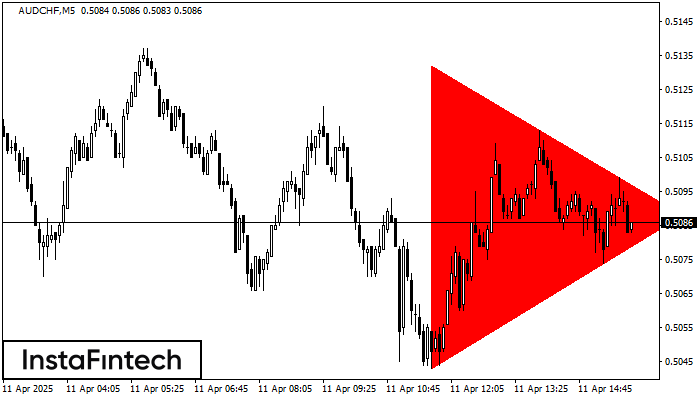
Berdasarkan carta M5, AUDCHF membentuk corak Segi Tiga Simetri Menurun. Cadangan dagangan: Penembusan sempadan bawah 0.5043 mungkin mendorong kepada kesinambungan aliran menurun
Carta masa M5 dan M15 mungkin mempunyai lebih banyak titik kemasukan palsu.
Open chart in a new window


