empty
27.02.2020 12:48 AM
EUR/USD. Results of February 26. China and Iran suspected of concealing the true extent of the spread of coronavirus

4-hour timeframe

This image is no longer relevant

Amplitude of the last 5 days (high-low): 52p - 26p - 43p - 80p - 67p - 60p.

Average volatility over the past 5 days: 56p (average).

The EUR/USD currency pair continued a not too strong upward correctional movement in the third trading day of the week against the downward trend of the last three weeks. The pair made another attempt to overcome the Ichimoku cloud on February 26, which again ended in failure. Formally, consolidation above the cloud took place, but very soon quotes of the euro/dollar pair returned to the Ichimoku cloud. Thus, the US currency has risen in price today, despite the fact that the pair continues to trade around three-year lows. Despite the fact that stock markets and indices in the United States collapsed this week. Despite the fact that the coronavirus continues to spread across the planet and its consequences can be very serious for the global economy, which has just recovered from trade wars. However, as we have repeatedly said, the COVID-2019 virus affects not only the US economy. It also has a negative impact on the European economy. Thus, nothing in the balance of power between the economies of the European Union and the United States does not change. Accordingly, in recent years there have been no new reasons for the appreciation of the euro or the fall of the US dollar. Not a single important macroeconomic report was published either in the European Union or in the United States on Wednesday. Thus, the fundamental and macroeconomic background was again completely empty. At the same time, the volatility of the pair remains at a fairly high level, about 60 points per day.

Since traders simply do not receive any important messages of an economic nature, one has to pay attention to secondary (for the currency market) news and messages. In the United States, for example, Secretary of State Mike Pompeo made a statement accusing China and Iran of hiding reliable information about the extent of the spread of the pneumonia virus. Beijing previously expelled three Wall Street reporters from China, which sparked a storm of criticism in America. The official reasons for the removal of journalists from China are unknown, but the American side believes that independent reporters are necessary in order for the world to receive reliable information about the infection problem. "The exile of our journalists draws attention to the problem of the PRC government, which previously led to an outbreak of SARS, and now to an outbreak of coronavirus, namely censorship. This can be fatal," said Pompeo. Similar allegations have been directed against Iran. According to Pompeo, in Iran the number of infections and deaths from the virus can be much higher than the government reports. Pompeo also said that the United States was deeply saddened by the fact that the Iranian government had concealed "important information about the infection." "All countries, including Iran, must tell the truth about the coronavirus and collaborate with international healthcare organizations," Pompeo summed up.

However, the coronavirus and its distribution do not yet directly affect the foreign exchange market. Yes, perhaps, amid the collapse of US stock markets, some investors are transferring their funds to safer assets, such as gold or franc, or the yen. However, the Chinese infection has not yet been reflected in the euro/dollar pair. Thus, the corrective movement is still ongoing, and it is very difficult to work out, as there is no news from the US and the EU, and the upward movement is extremely uncertain.

Trading recommendations:

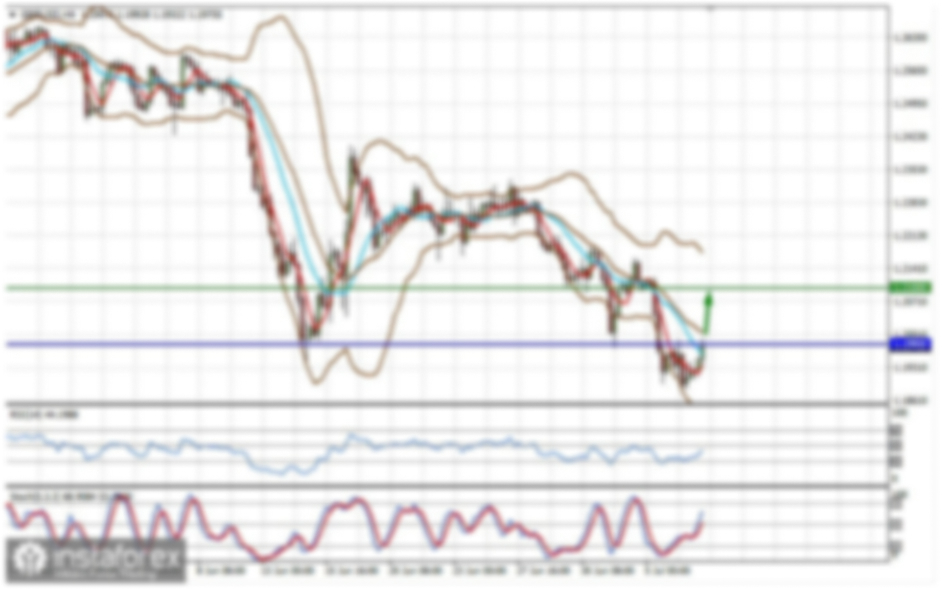
The EUR/USD pair continues to be a corrective movement. Thus, now we can formally consider long positions with targets of 1.0915 and 1.0936 after the MACD indicator turns up, which will indicate the completion of a correction round, but only with small lots or not at all. It will be possible to return to selling the pair with targets at support levels of 1.0824 and 1.0795, if traders manage to gain a foothold back below the critical line.

Explanation of the illustration:

Ichimoku indicator:

Tenkan-sen is the red line.

Kijun-sen is the blue line.

Senkou Span A - light brown dotted line.

Senkou Span B - light purple dashed line.

Chikou Span - green line.

Bollinger Bands Indicator:

3 yellow lines.

MACD indicator:

Red line and bar graph with white bars in the indicators window.

Support / Resistance Classic Levels:

Red and gray dashed lines with price symbols.

Pivot Level:

Yellow solid line.

Volatility Support / Resistance Levels:

Gray dotted lines without price designations.

Possible price movements:

Red and green arrows.

Pilih carta masa
5
min
15
min
30
min
1
jam
4
jam
1
hari
1
minggu
Jana pendapatan melalui perubahan kadar mata wang kripto dengan InstaForex.
Muat turun MetaTrader 4 dan buka dagangan pertama anda.
  • Grand Choice
    Contest by
    InstaForex
    InstaForex always strives to help you
    fulfill your biggest dreams.
    SERTAI PERADUAN

Artikel yang dicadangkan

Analisis Teknikal Pergerakan Harga Harian Indeks Nasdaq 100, Khamis 04 Januari 2024.

Pada carta harian, indeks Nasdaq 100 nampaknya memperlihatkan pergerakan harga dan Tenkansen, Kinjun Sen, serta Chikou Span di atas Kumo, yang menandakan momentum Kenaikan harga masih cukup kuat. Namun, dengan

Arief Makmur 07:14 2024-01-04 UTC+2

Analisis Teknikal Pergerakan Harga Harian Indeks Nasdaq 100, Khamis 28 Disember 2023.

Dengan keadaan Tenkansen & Kinjunsen yang bersilang dengan Golden Cross di atas Kumo dan Chikou Span serta pergerakan harga yang juga di atas Kumo, maka sekarang ini jelas bahawa kecenderungan

Arief Makmur 05:27 2023-12-28 UTC+2

Analisis Teknikal Pergerakan Harga Harian Pasangan Mata Wang GBP/AUD, Khamis 21 Disember 2023.

Pada carta harian, pasangan mata wang GBP/AUD kelihatan ada pergerakan harga di bawah Kumo yang diikuti oleh Chikou Span dan Tenkansen dan Kinjun Sen (Death Cross) yang juga di bawah

Arief Makmur 08:15 2023-12-21 UTC+2

Analisis Teknikal Pergerakan Harga Harian AUD/JPY Pasangan Mata Wang Bersilang, Rabu, 20 Disember 2023.

Dengan keadaan Tenkansen dan Kinjunsen di dalam Kumo serta Chikou Span yang terletak di tengah Carta Bar, ini memberikan petunjuk bahawa pada masa ini pasangan AUD/JPY sedang bergerak dalam keadaan

Arief Makmur 09:18 2023-12-20 UTC+2

Analisis indikator Ichimoku cloud pasangan mata wang EURUSD untuk 13 September 2023.

Pasangan mata wang EURUSD diniagakan sekitar tahap 1.0734. Dalam Ichimoku cloud, trend masih menurun kerana harga kekal di bawah Kumo (cloud) dalam carta 4 Jam. Harga baru-baru ini melantun

Alexandros Yfantis 12:29 2023-09-13 UTC+2

Analisis indikator Ichimoku cloud pasangan mata wang EURUSD untuk 22 Ogos 2023.

Pasangan mata wang EURUSD kini diniagakan di sekitar tahap 1.0905-1.0910. Dalam terma Ichimoku cloud, arah aliran dalam carta 4 Jam adalah menurun kerana harga kekal di bawah Kumo (cloudd). Dalam

Alexandros Yfantis 11:51 2023-08-22 UTC+2

Indikator Awan Ichimoku untuk 22 Ogos 2023. Pasangan USDJPY untuk 22 Ogos,

Pasangan USD/JPY kini didagangkan di sekitar 145.70. Berdasarkan carta 4 jam mengikut petunjuk awan Ichimoku, trend kekal menaik kerana harga masih di atas awan. Namun, harga kini mencabar tenkan-sen (petunjuk

Alexandros Yfantis 11:44 2023-08-22 UTC+2

Analisis indikator cloud Ichimoku pada Emas untuk 12 April 2023.

Harga emas kini diniagakan sekitar $2,013. Trend jangka pendek masih menunjukkan kenaikan harga kerana harga masih di atas Kumo (cloud). Kami menggunakan indikator cloud Ichimoku untuk mengenal pasti tahap sokongan

Alexandros Yfantis 02:51 2023-04-13 UTC+2

Analisis indikator cloud Ichimoku pada Emas untuk 28 Mac, 2023.

Harga emas didagangkan sekitar $1,968. Mengikut arah aliran indikator cloud Ichimoku kekal menaik. Setakat ini tidak ada tanda-tanda penurunan atau pembalikan. Harga baru-baru ini ditarik balik ke arah tenkan-sen (indikator

Alexandros Yfantis 03:11 2023-03-29 UTC+2

Analisis indikator cloud Ichimoku pada EURUSD untuk 27 Februari 2023.

EURUSD didagangkan sekitar 1.06 dalam arah aliran menurun mengikut carta 4 jam menggunakan indikator cloud Ichimoku. Harga kekal di bawah 4 jam Kumo (cloud). Terdapat beberapa tanda yang menunjukkan lantunan

Alexandros Yfantis 03:20 2023-02-28 UTC+2
Tidak boleh bertanya sekarang?
Tanya soalan anda di Ruangan bersembang.
Panggilan semula Widget
 

Dear visitor,

Your IP address shows that you are currently located in the USA. If you are a resident of the United States, you are prohibited from using the services of InstaFintech Group including online trading, online transfers, deposit/withdrawal of funds, etc.

If you think you are seeing this message by mistake and your location is not the US, kindly proceed to the website. Otherwise, you must leave the website in order to comply with government restrictions.

Why does your IP address show your location as the USA?

  • - you are using a VPN provided by a hosting company based in the United States;
  • - your IP does not have proper WHOIS records;
  • - an error occurred in the WHOIS geolocation database.

Please confirm whether you are a US resident or not by clicking the relevant button below. If you choose the wrong option, being a US resident, you will not be able to open an account with InstaForex anyway.

We are sorry for any inconvenience caused by this message.