signal strength 2 of 5
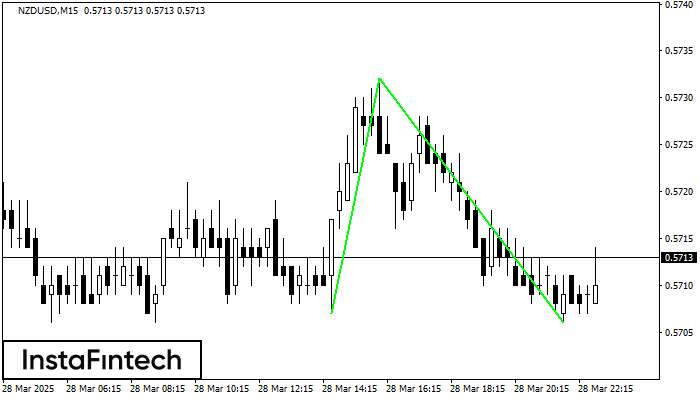
The Double Bottom pattern has been formed on NZDUSD M15; the upper boundary is 0.5732; the lower boundary is 0.5706. The width of the pattern is 25 points. In case of a break of the upper boundary 0.5732, a change in the trend can be predicted where the width of the pattern will coincide with the distance to a possible take profit level.
The M5 and M15 time frames may have more false entry points.
See Also
- All
- Double Top
- Flag
- Head and Shoulders
- Pennant
- Rectangle
- Triangle
- Triple top
- All
- #AAPL
- #AMZN
- #Bitcoin
- #EBAY
- #FB
- #GOOG
- #INTC
- #KO
- #MA
- #MCD
- #MSFT
- #NTDOY
- #PEP
- #TSLA
- #TWTR
- AUDCAD
- AUDCHF
- AUDJPY
- AUDUSD
- EURCAD
- EURCHF
- EURGBP
- EURJPY
- EURNZD
- EURRUB
- EURUSD
- GBPAUD
- GBPCHF
- GBPJPY
- GBPUSD
- GOLD
- NZDCAD
- NZDCHF
- NZDJPY
- NZDUSD
- SILVER
- USDCAD
- USDCHF
- USDJPY
- USDRUB
- All
- M5
- M15
- M30
- H1
- D1
- All
- Buy
- Sale
- All
- 1
- 2
- 3
- 4
- 5
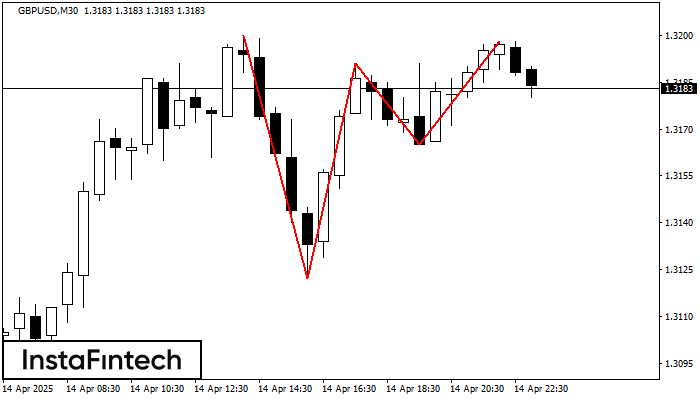
Corak Triple Top telah dibentuk pada carta bagi instrumen dagangan GBPUSD M30. Ia adalah corak pembalikan yang memaparkan ciri-ciri berikut: tahap rintangan 2, tahap sokongan -43, dan lebar corak
Open chart in a new window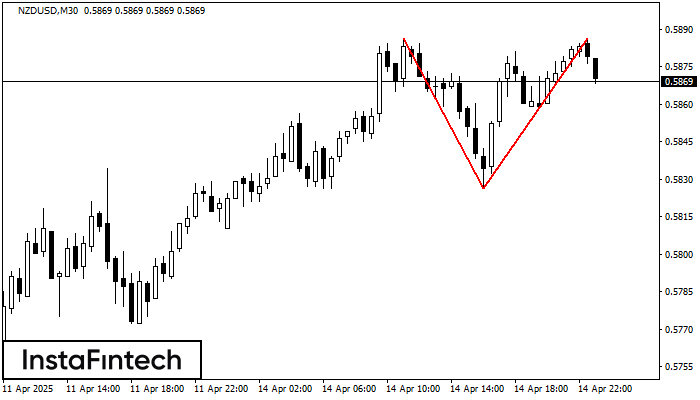
Corak pembalikan Double Top telah dibentuk pada NZDUSD M30. Ciri-ciri: sempadan atas %P0.000000; sempadan bawah 0.5886; sempadan bawah 0.5826; lebar corak adalah 60 mata. Dagangan menjual adalah lebih baik untuk
Open chart in a new window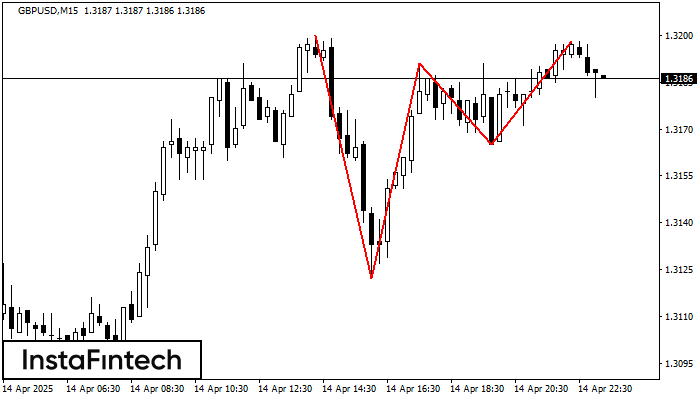
Pada carta instrumen dagangan GBPUSD M15, corak Triple Top yang menandakan perubahan aliran telah terbentuk. Adalah mungkin bahawa selepas pembentukan bahagian atas ketiga, harga akan cuba menembusi tahap rintangan 1.3122
Carta masa M5 dan M15 mungkin mempunyai lebih banyak titik kemasukan palsu.
Open chart in a new window