signal strength 4 of 5

According to the chart of H1, #Bitcoin formed the Bearish Symmetrical Triangle pattern. Description: The lower border is 81178.46/83101.84 and upper border is 85102.23/83101.84. The pattern width is measured on the chart at -392377 pips. The formation of the Bearish Symmetrical Triangle pattern evidently signals a continuation of the downward trend. In other words, if the scenario comes true and #Bitcoin breaches the lower border, the price could continue its move toward 83101.44.
See Also
- All
- Double Top
- Flag
- Head and Shoulders
- Pennant
- Rectangle
- Triangle
- Triple top
- All
- #AAPL
- #AMZN
- #Bitcoin
- #EBAY
- #FB
- #GOOG
- #INTC
- #KO
- #MA
- #MCD
- #MSFT
- #NTDOY
- #PEP
- #TSLA
- #TWTR
- AUDCAD
- AUDCHF
- AUDJPY
- AUDUSD
- EURCAD
- EURCHF
- EURGBP
- EURJPY
- EURNZD
- EURRUB
- EURUSD
- GBPAUD
- GBPCHF
- GBPJPY
- GBPUSD
- GOLD
- NZDCAD
- NZDCHF
- NZDJPY
- NZDUSD
- SILVER
- USDCAD
- USDCHF
- USDJPY
- USDRUB
- All
- M5
- M15
- M30
- H1
- D1
- All
- Buy
- Sale
- All
- 1
- 2
- 3
- 4
- 5
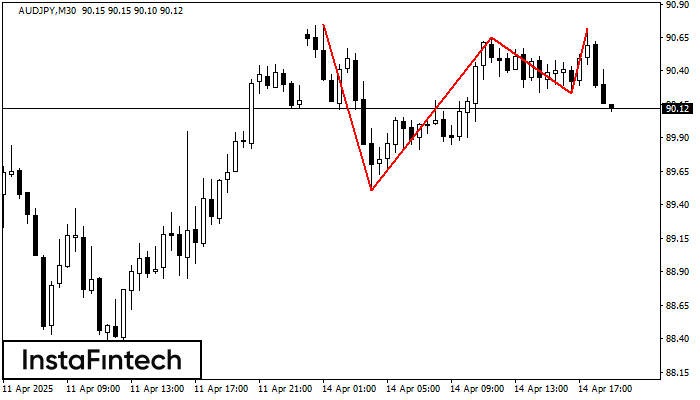
En el gráfico del instrumento de negociación AUDJPY M30, se ha formado el patrón Triple Techo que señala un cambio en la tendencia. Es posible que después de la formación
Open chart in a new window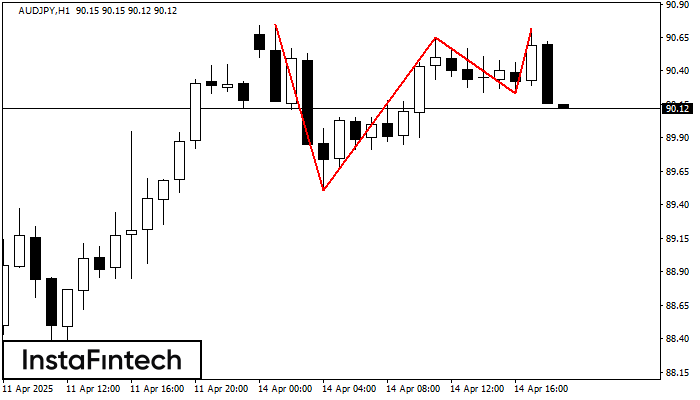
En el gráfico del instrumento de negociación AUDJPY H1, se ha formado el patrón Triple Techo que señala un cambio en la tendencia. Es posible que después de la formación
Open chart in a new window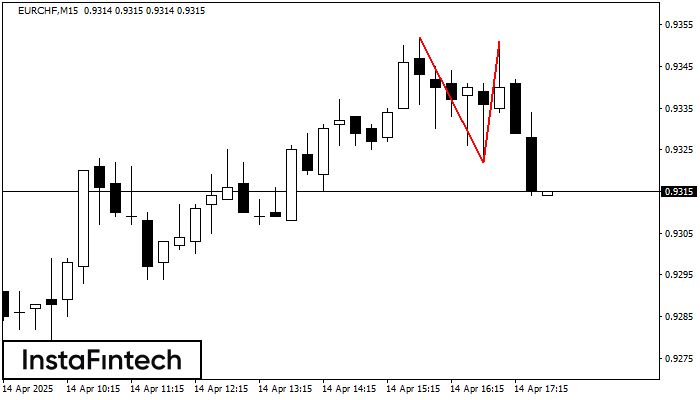
En el gráfico de EURCHF M15 el patrón de reversión Doble Techo ha sido formado. Características: límite superior 0.9351; límite inferior 0.9322; el ancho del patrón 29 puntos. La señal
Los marcos de tiempo M5 y M15 pueden tener más puntos de entrada falsos.
Open chart in a new window