signal strength 1 of 5

The Bearish pennant pattern has formed on the AUDCHF M5 chart. The pattern signals continuation of the downtrend in case the pennant’s low of 0.5526 is broken through. Recommendations: Place the sell stop pending order 10 pips below the pattern’s low. Place the take profit order at the projection distance of the flagpole height.
The M5 and M15 time frames may have more false entry points.
See Also
- All
- Double Top
- Flag
- Head and Shoulders
- Pennant
- Rectangle
- Triangle
- Triple top
- All
- #AAPL
- #AMZN
- #Bitcoin
- #EBAY
- #FB
- #GOOG
- #INTC
- #KO
- #MA
- #MCD
- #MSFT
- #NTDOY
- #PEP
- #TSLA
- #TWTR
- AUDCAD
- AUDCHF
- AUDJPY
- AUDUSD
- EURCAD
- EURCHF
- EURGBP
- EURJPY
- EURNZD
- EURRUB
- EURUSD
- GBPAUD
- GBPCHF
- GBPJPY
- GBPUSD
- GOLD
- NZDCAD
- NZDCHF
- NZDJPY
- NZDUSD
- SILVER
- USDCAD
- USDCHF
- USDJPY
- USDRUB
- All
- M5
- M15
- M30
- H1
- D1
- All
- Buy
- Sale
- All
- 1
- 2
- 3
- 4
- 5
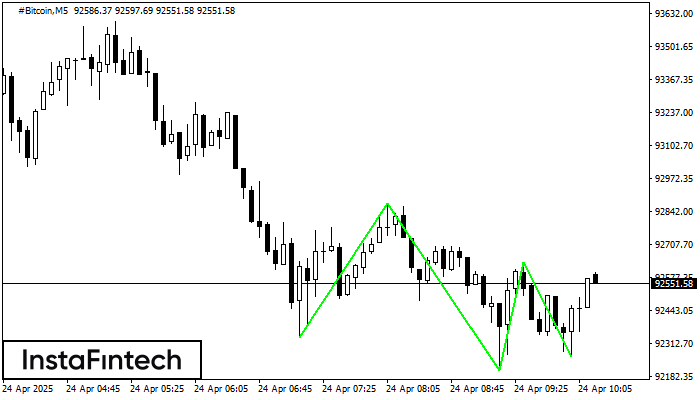
The Triple Bottom pattern has formed on the chart of #Bitcoin M5. Features of the pattern: The lower line of the pattern has coordinates 92871.00 with the upper limit 92871.00/92637.22
The M5 and M15 time frames may have more false entry points.
Open chart in a new window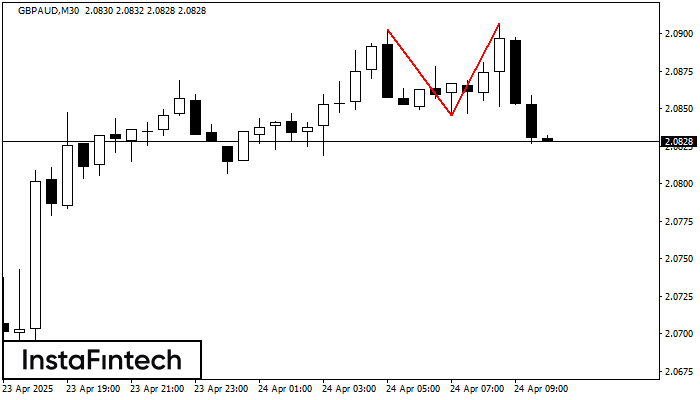
The Double Top pattern has been formed on GBPAUD M30. It signals that the trend has been changed from upwards to downwards. Probably, if the base of the pattern 2.0846
Open chart in a new window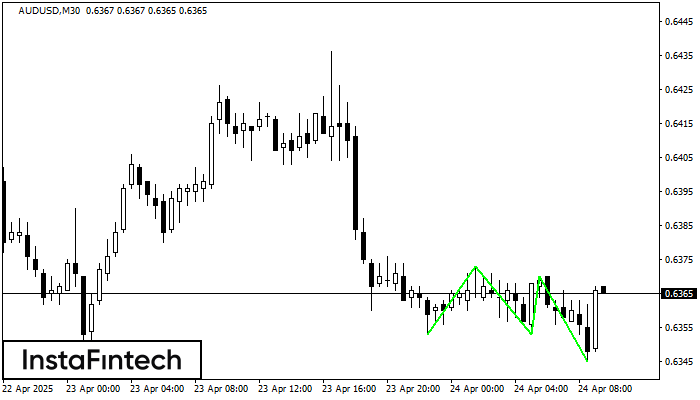
The Triple Bottom pattern has formed on the chart of AUDUSD M30. Features of the pattern: The lower line of the pattern has coordinates 0.6373 with the upper limit 0.6373/0.6370
Open chart in a new window