

signal strength 1 of 5

The Bullish Flag pattern has been formed on the chart AUDCHF M5 which signals that the upward trend will continue. Signals: а break of the peak at 0.5551 may push the price higher, and the rise will be the projection of the pole.
The M5 and M15 time frames may have more false entry points.
- All
- Double Top
- Flag
- Head and Shoulders
- Pennant
- Rectangle
- Triangle
- Triple top
- All
- #AAPL
- #AMZN
- #Bitcoin
- #EBAY
- #FB
- #GOOG
- #INTC
- #KO
- #MA
- #MCD
- #MSFT
- #NTDOY
- #PEP
- #TSLA
- #TWTR
- AUDCAD
- AUDCHF
- AUDJPY
- AUDUSD
- EURCAD
- EURCHF
- EURGBP
- EURJPY
- EURNZD
- EURRUB
- EURUSD
- GBPAUD
- GBPCHF
- GBPJPY
- GBPUSD
- GOLD
- NZDCAD
- NZDCHF
- NZDJPY
- NZDUSD
- SILVER
- USDCAD
- USDCHF
- USDJPY
- USDRUB
- All
- M5
- M15
- M30
- H1
- D1
- All
- Buy
- Sale
- All
- 1
- 2
- 3
- 4
- 5
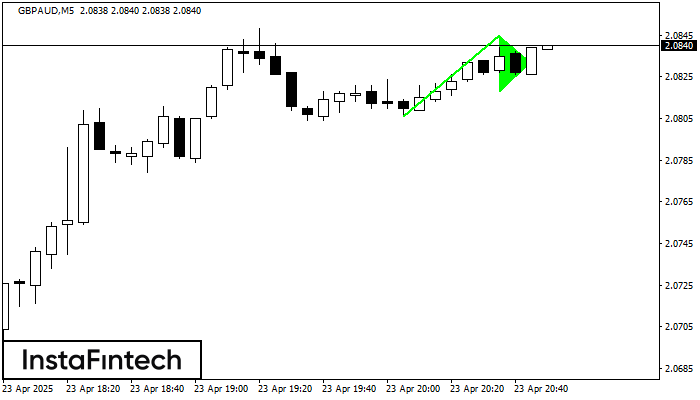
The Bullish pennant signal – Trading instrument GBPAUD M5, continuation pattern. Forecast: it is possible to set up a buy position above the pattern’s high of 2.0845, with the prospect
The M5 and M15 time frames may have more false entry points.
Open chart in a new window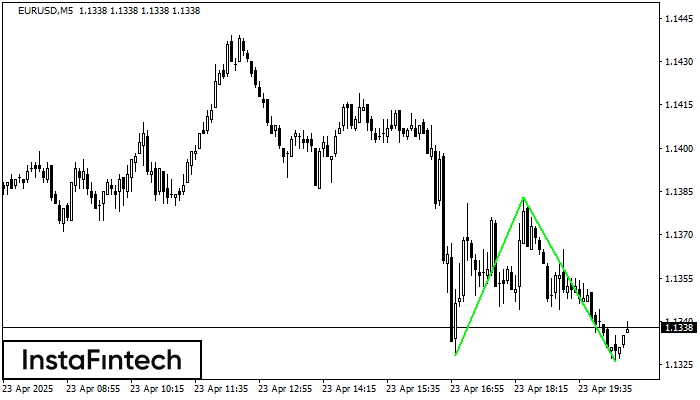
The Double Bottom pattern has been formed on EURUSD M5. This formation signals a reversal of the trend from downwards to upwards. The signal is that a buy trade should
The M5 and M15 time frames may have more false entry points.
Open chart in a new window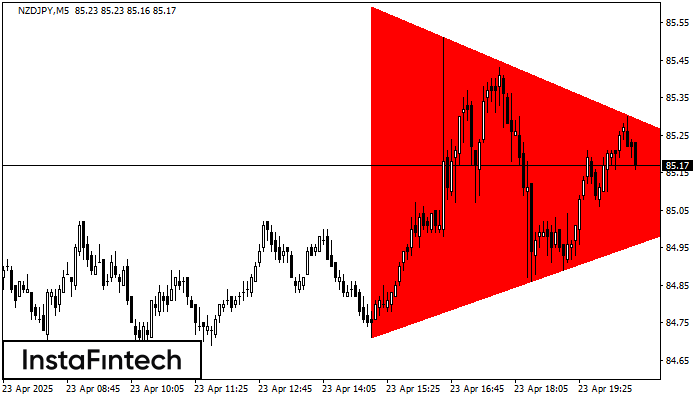
According to the chart of M5, NZDJPY formed the Bearish Symmetrical Triangle pattern. Trading recommendations: A breach of the lower border 84.71 is likely to encourage a continuation
The M5 and M15 time frames may have more false entry points.
Open chart in a new window


