empty
13.11.2023 06:29 AM
EUR/USD and GBP/USD: Technical analysis for November 13

EUR/USD

This image is no longer relevant

Higher Timeframes

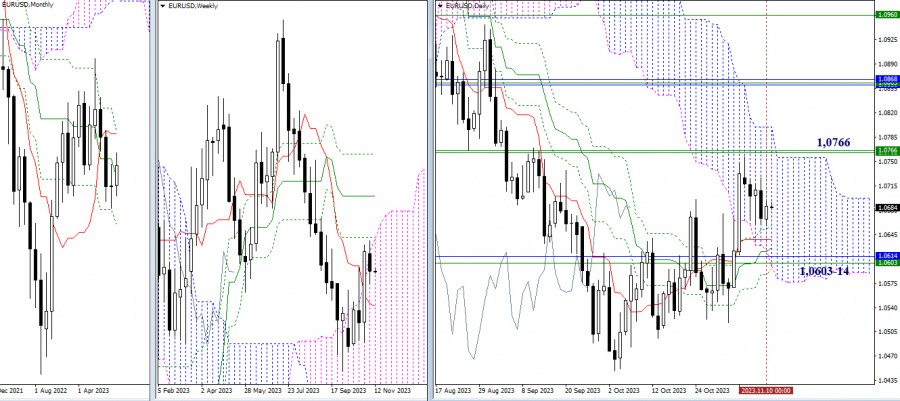
The confirmation and development of the bullish sentiment did not succeed. The entire past week was occupied by a decrease and consolidation. As a result, the pair remained within the boundaries, breaking which could help change the current situation and provide new prospects for continued movement. At the moment, the market from above is limited by the accumulation of resistances around 1.0766 (weekly levels + upper boundary of the daily cloud), and below, its supports, except for the daily Ichimoku cross (1.0657 – 1.0638 – 1.0627 – 1.0588), include the weekly short-term trend (1.0603) and the monthly medium-term trend (1.0614).

This image is no longer relevant

H4 – H1

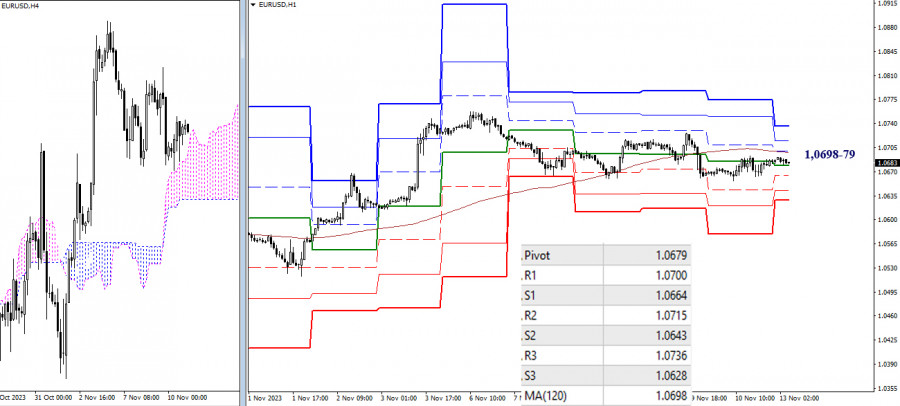
On lower timeframes, the market continues to be constrained by key levels, currently consolidating efforts around 1.0698-79 (central pivot point + weekly long-term trend). The prolonged lack of directional movement indicates uncertainty and a wait-and-see position, although the main advantage remains on the bears' side. Intraday bearish targets today can be marked at 1.0664 – 1.0643 – 1.0628 (supports of classic pivot points). Consolidation above 1.0698-79 and a reversal of the movement can change the current balance of power on the lower timeframes. And for further strengthening of bullish sentiment, players will need to overcome the resistances R2 (1.0715) and R3 (1.0736) of classic pivot points.

***

GBP/USD

This image is no longer relevant

Higher timeframes

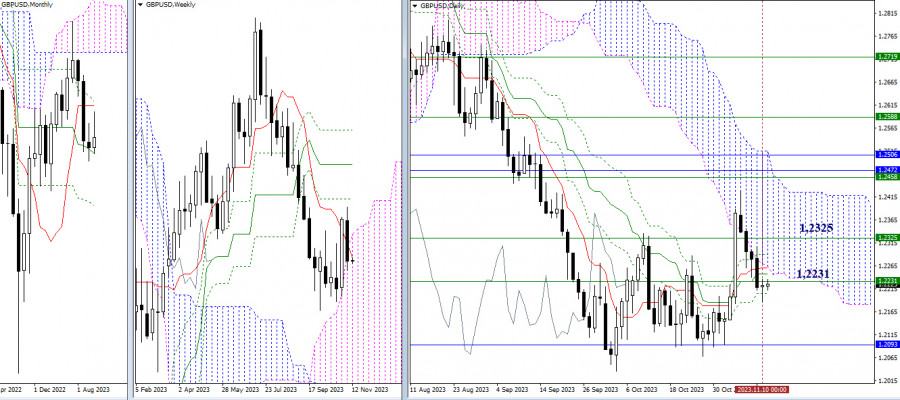
Last week, bears could not completely neutralize all the previous achievements of the opponent. Nevertheless, they managed to decline below many current supports, so all the nearest levels (1.2231 – 1.2248 – 1.2260 – 1.2264 – 1.2290 – 1.2325) passed last week are now transformed into resistances, playing the role of top-priority tasks for bulls to restore their positions. For bears, it is still important to eliminate the daily Ichimoku cross (1.2205), overcome the support of the monthly medium-term trend (1.2093), and restore the downward trend (1.2036).

This image is no longer relevant

H4 – H1

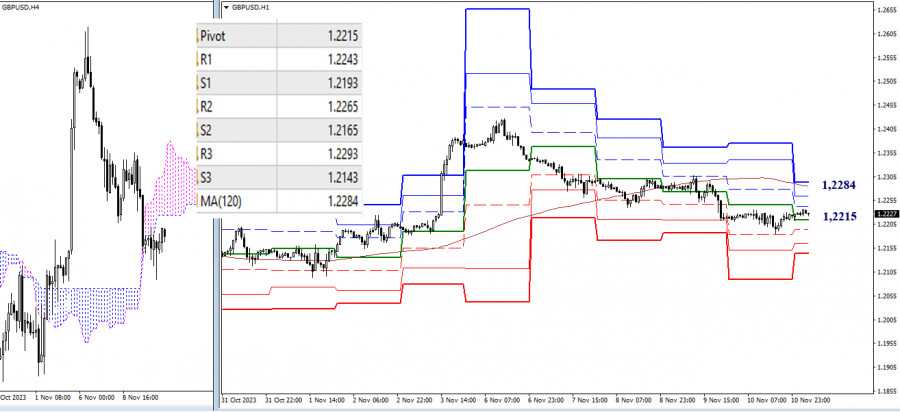
At the moment, bears have the main advantage. To change the situation, bulls need to rise and consolidate above the weekly long-term trend (1.2284), turning the movement in their favor. Intraday bearish targets during the continuation of the decline today will encounter the market at 1.2215 – 1.2193 – 1.2165 – 1.2143 (classic pivot points).

***

The technical analysis of the situation uses:

Higher timeframes - Ichimoku Kinko Hyo (9.26.52) + Fibonacci Kijun levels

Lower timeframes - H1 - Pivot Points (classic) + Moving Average 120 (weekly long-term trend)

Evangelos Poulakis,
Especialista em análise na InstaForex
© 2007-2025
Selecionar intervalo de tempo
5
min
15
min
30
min
1
hora
4
horas
1
dia
1
s.
Ganhe com as variações das taxas das criptomoedas com a InstaForex.
Baixe o MetaTrader 4 e abra a sua primeira operação.
  • Grand Choice
    Contest by
    InstaForex
    InstaForex always strives to help you
    fulfill your biggest dreams.
    PARTICIPE DO CONCURSO

Recommended Stories

Sinais de negociação para EUR/USD para 28-30 de abril de 2025: venda abaixo de 1,1370 (SMA 21 - 7/8 de Murray)

Por outro lado, se a pressão de baixa prevalecer e o euro se consolidar abaixo de 1,1370, isso pode ser interpretado como um sinal de venda, com alvos no nível

Dimitrios Zappas 16:47 2025-04-28 UTC+2

Sinais de negociação para o OURO (XAU/USD) para 28-30 de abril de 2025: comprar acima de $3.270 ( SMA 21 - 7/8 de Murray)

O indicador Eagle está mostrando sinais de sobrevenda, portanto, acreditamos que o ouro poderia retomar seu ciclo de alta no curto prazo após uma correção técnica e atingir o nível

Dimitrios Zappas 16:43 2025-04-28 UTC+2

USD/JPY –Resumo e perspectivas

Na semana passada, o mercado renovou a mínima, mas os vendedores não conseguiram dar continuidade plena ao movimento de queda. Isso pode ter ocorrido porque a mínima da semana anterior

Evangelos Poulakis 16:20 2025-04-28 UTC+2

OURO – Visão geral da análise técnica

Na semana passada, os touros renovaram as máximas históricas, formando um novo pico em 3.499,58. Em seguida, o ouro iniciou uma correção de baixa, aproximando-se do suporte da tendência diária

Evangelos Poulakis 14:36 2025-04-28 UTC+2

Sinais de negociação para o EUR/USD para 24-26 de abril de 2025: venda abaixo de 1,1435 (SMA 214 - 7/8 de Murray)

Nosso plano de negociação para as próximas horas é aguardar que o euro se recupere até os níveis de resistência próximos de 1,1429 ou 1,1435 para vender, com alvos

Dimitrios Zappas 21:44 2025-04-24 UTC+2

Análise técnica do movimento de preço da prata, quinta-feira, 24 de abril de 2025

No gráfico de 4 horas, o instrumento da commodity prata apresenta sinais de fortalecimento. Esse cenário é confirmado pelo movimento do preço, que está acima da WMA (30, deslocamento 2)

Arief Makmur 17:28 2025-04-24 UTC+2

Análise técnica do movimento de preços do índice Nasdaq 100, quinta-feira, 24 de abril de 2025.

Embora o índice Nasdaq 100 esteja se movimentando lateralmente no gráfico de 4 horas, a faixa de oscilação é relativamente ampla, o que ainda representa uma oportunidade promissora. Atualmente

Arief Makmur 17:25 2025-04-24 UTC+2

OURO: Os preços do ouro podem cair significativamente em um futuro próximo

Os preços do ouro passaram recentemente por uma correção significativa, refletindo as expectativas de que Estados Unidos e China iniciem negociações concretas sobre tarifas e comércio em geral. A declaração

Pati Gani 17:16 2025-04-24 UTC+2

Análise técnica do movimento intradiário de preços do AUD/JPY, quarta-feira, 23 de abril de 2025

Com a presença de uma divergência entre o movimento de preços do par AUD/JPY e o indicador Stochastic Oscillator, além do preço estar acima da média móvel ponderada (WMA)

Arief Makmur 16:00 2025-04-23 UTC+2
Não pode falar agora?
Faça sua pergunta no chat.
Widget callback
 

Dear visitor,

Your IP address shows that you are currently located in the USA. If you are a resident of the United States, you are prohibited from using the services of InstaFintech Group including online trading, online transfers, deposit/withdrawal of funds, etc.

If you think you are seeing this message by mistake and your location is not the US, kindly proceed to the website. Otherwise, you must leave the website in order to comply with government restrictions.

Why does your IP address show your location as the USA?

  • - you are using a VPN provided by a hosting company based in the United States;
  • - your IP does not have proper WHOIS records;
  • - an error occurred in the WHOIS geolocation database.

Please confirm whether you are a US resident or not by clicking the relevant button below. If you choose the wrong option, being a US resident, you will not be able to open an account with InstaForex anyway.

We are sorry for any inconvenience caused by this message.