empty

InstaForex - sempre na vanguarda! Abra uma conta de negociação e torne-se parte da Equipe InstaForex Loprais!

A história de sucesso da equipe liderada por Ales Loprais pode se tornar sua história de sucesso! Entregue com confiança e vá em direção à liderança como participante regular do Dakar Rally e vencedor do Rally da Silk Way A Equipe InstaForex Loprais faz isso!

Junte-se e vença com a InstaForex!

logo InstaForex
Open an InstaForex trading account
Trading account verification

The registration process will not take long. It will provide a decisive beginner with a wide range of opportunities to start trading in the forex market successfully. You will immediately receive a welcome bonus that will double your deposit!

You have successfully registered a trading account. Now we offer you to verify your account. Verification is optional, but it allows you to replenish your trading account through credit and debit cards as well as a number of other payment systems. This is the key that opens access to the entire range of the company’s services.

Step 1
Step 2
A confirmation code has been sent to your email address
MT4
MT4 is designed exclusively for trading on the Forex currency market.
MT5
MT5 provides access to multi-market trading.

Congratulations! You have registered with InstaForex.

The password was also sent to the email address specified by you. Please note that login and password are valid only for the MetaTrader 4 trading platform.

You can open several trading accounts for different financial transactions - Open another trading account.

Download trading platform

toolbar icon

16.01.2025 04:19 AM
Trading Recommendations and Analysis for EUR/USD on January 16: Another Logical Collapse

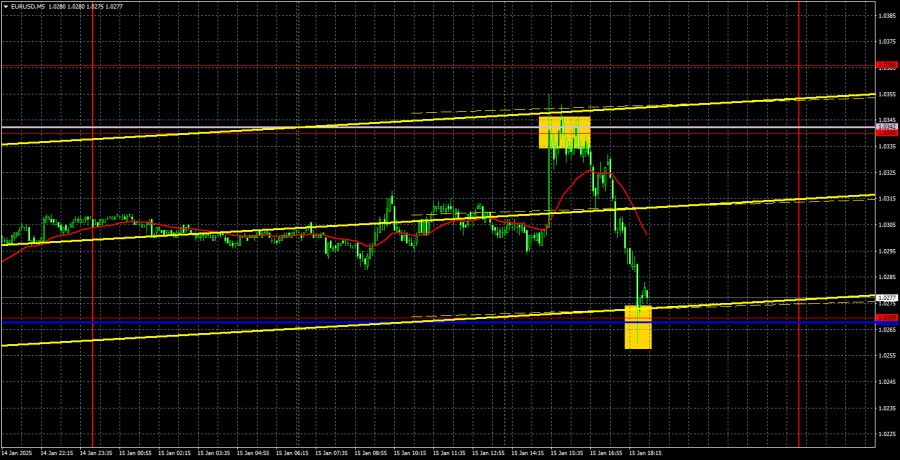
EUR/USD 5-Minute Analysis

This image is no longer relevant

On Wednesday, the EUR/USD currency pair initially traded upward for most of the day but later lost all its gains as the euro declined significantly. In our fundamental analysis, we highlighted the mixed nature of the U.S. inflation report. The market's initial reaction was to sell the dollar, which seemed somewhat irrational. While the headline inflation figure met expectations, U.S. inflation still increased, indicating that the Federal Reserve might not lower rates as much as the two modest rate cuts anticipated in 2025. This situation is further complicated by Donald Trump's upcoming presidency, which may bring various tariffs that could escalate global inflation.

The evening decline in the euro was more understandable. First, the global downtrend remains in effect. Second, the fundamental and macroeconomic conditions continue to favor the dollar. Third, the price corrected and rebounded precisely from the Senkou Span B line. Even on the previous day, there were reasons to consider buying the dollar again, despite the mixed inflation report.

Trading signals on Wednesday were excellent. During the U.S. session, the currency pair tested the 1.0340 level and the Senkou Span B line, rebounding sharply. This was followed by a decline that again tested this critical line, from which the price also bounced. As a result, traders had the opportunity to open two trades that yielded profit. A long position can even be maintained.

COT Report

This image is no longer relevant

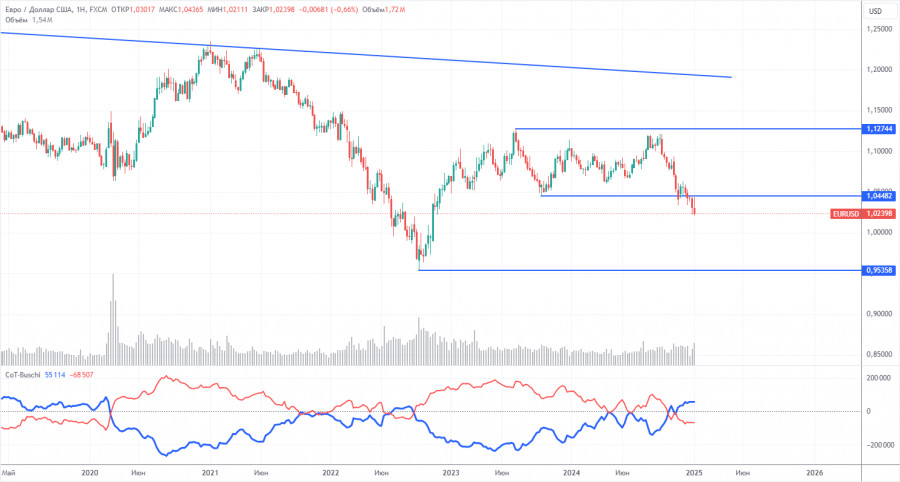
The latest Commitment of Traders (COT) report, dated December 31, indicates that non-commercial traders maintain a bullish net position. However, bears have recently gained the upper hand. Two months ago, the number of short positions among professional traders surged, resulting in a negative net position for the first time in a long while. This change suggests that the euro is being sold more frequently than it is being bought.

We have yet to identify any fundamental drivers for euro strength. From a technical perspective, the EUR/USD pair has been consolidating for quite some time. On the weekly timeframe, it has traded between 1.0448 and 1.1274 since December 2022. The breach of the 1.0448 level has opened the door for further declines.

Additionally, the COT data shows that the red and blue lines have crossed, signaling a bearish market sentiment. In the last reporting week, long positions among non-commercial traders increased by 9,300, while short positions rose by 10,400, resulting in a reduction of the net position by 1,100.

EUR/USD 1-Hour Analysis

This image is no longer relevant

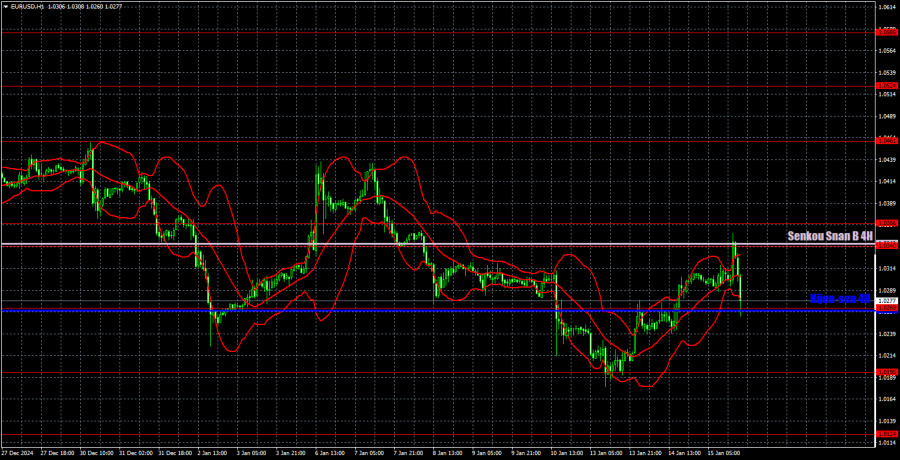
On the hourly chart, the currency pair has resumed its downtrend, which has persisted for over three months. We believe this decline will continue in the medium term. The Fed might cut interest rates just 1–2 times in 2025, indicating a more hawkish stance than the market initially expected. This factor, among others, will continue to support the U.S. dollar. The bearish sentiment remains intact below the Ichimoku indicator lines, even in the short term.

For trading on January 16, the following levels are highlighted: 1.0124, 1.0195, 1.0269, 1.0340–1.0366, 1.0461, 1.0524, 1.0585, 1.0658–1.0669, 1.0757, 1.0797, and 1.0843, as well as the Senkou Span B (1.0342) and Kijun-sen (1.0267) lines. Please note that the Ichimoku indicator lines may shift throughout the day, which should be considered when determining trading signals. Remember to set a Stop Loss at breakeven if the price moves 15 pips in your favor, to protect against potential losses from false signals.

On Thursday, the Eurozone will release a secondary report on German inflation, while the U.S. is set to publish slightly more significant retail sales data and equally secondary jobless claims. Therefore, we do not expect strong price movements today. Below the Senkou Span B line, even a short-term uptrend remains unlikely.

Illustration Explanations:

  • Support and Resistance Levels (thick red lines): Thick red lines indicate where movement may come to an end. Please note that these lines are not sources of trading signals.
  • Kijun-sen and Senkou Span B Lines: Ichimoku indicator lines transferred from the 4-hour timeframe to the hourly timeframe. These are strong lines.
  • Extreme Levels (thin red lines): Thin red lines where the price has previously bounced. These serve as sources of trading signals.
  • Yellow Lines: Trendlines, trend channels, or any other technical patterns.
  • Indicator 1 on COT Charts: Represents the net position size for each category of traders.
Paolo Greco,
Especialista em análise na InstaForex
© 2007-2025
Selecionar intervalo de tempo
5
min
15
min
30
min
1
hora
4
horas
1
dia
1
s.
Ganhe com as variações das taxas das criptomoedas com a InstaForex.
Baixe o MetaTrader 4 e abra a sua primeira operação.
  • Chancy Deposit
    Deposite US $ 3.000 em sua conta e receba $10000 mais!
    Em Janeiro nós sorteamos $10000 na campanha Chancy Deposit!
    Tenha a chance de ganhar, depositando $3,000 em sua conta de negociação. Após cumprir essa condição, você se torna um participante da campanha.
    PARTICIPE DO CONCURSO

Recommended Stories

GBP/USD: Plano de negociação para a sessão dos E.U.A. de 24 de janeiro (análise das negociações da manhã)

Na minha previsão matinal, concentrei-me no nível 1,2412 e planejei tomar decisões de negociação com base nele. Vamos dar uma olhada no gráfico de 5 minutos e analisar

Miroslaw Bawulski 20:28 2025-01-24 UTC+2

EUR/USD: Plano de negociação para a sessão dos E.U.A. de 24 de janeiro (análise das negociações da manhã)

Na minha previsão da manhã, foquei no nível 1,0454 e planejei tomar decisões de negociação com base nele. Vamos dar uma olhada no gráfico de 5 minutos

Miroslaw Bawulski 20:21 2025-01-24 UTC+2

EUR/USD: Plano de Negociação para a Sessão dos E.U.A. de 23 de janeiro (Revisão das Negociações da Manhã)

Na minha previsão da manhã, destaquei o nível 1,0417 e planejei basear as decisões de negociação nele. Vamos dar uma olhada no gráfico de 5 minutos e analisar

Miroslaw Bawulski 20:58 2025-01-23 UTC+2

GBP/USD: Plano de Negociação para a Sessão dos E.U. de 23 de janeiro (Revisão das Negociações da Manhã)

Em minha previsão matinal, destaquei o nível 1,2325 como um ponto para tomar decisões de entrada no mercado. Vamos examinar o gráfico de 5 minutos para entender o que aconteceu

Miroslaw Bawulski 19:46 2025-01-23 UTC+2

Zonas de margem e ideias de negociação para o S&P 500 e NASDAQ (20 de janeiro de 2025 - 24 de janeiro de 2025)

Tendência de longo prazo: Incerteza temporária. Para oportunidades de compra, aguarde um padrão em zigue-zague e um rompimento acima de 6099,43. Para oportunidades de venda, aguarde um padrão de zigue-zague

13:55 2025-01-20 UTC+2

GBP/USD: Plano de negociação para a sessão dos E.U. de 16 de janeiro (análise das operações da manhã). A libra permanece sob pressão

Na minha previsão da manhã, concentrei-me no nível 1,2194 e planejei tomar decisões de negociação com base em seu comportamento. Vamos analisar o gráfico de 5 minutos para

Miroslaw Bawulski 17:09 2025-01-16 UTC+2

EUR/USD: Plano de negociação para a sessão dos E.U.A. de 16 de janeiro (análise do período matinal)

Na previsão matinal, foquei no nível 1,0299 e planejei tomar decisões de negociação com base no comportamento desse nível. Vamos analisar o gráfico de 5 minutos para entender

Miroslaw Bawulski 16:22 2025-01-16 UTC+2

GBP/USD: Plano de Negociação para a Sessão dos E.U.A. de 15 de janeiro (Análise da Negociação da Manhã)

Em minha previsão da manhã, destaquei o nível 1,2194 como um ponto-chave de decisão para a entrada no mercado. Vamos revisar o gráfico de 5 minutos e analisar

Miroslaw Bawulski 16:43 2025-01-15 UTC+2

EUR/USD: Plano de Negociação para a Sessão dos E.U.A. de 15 de janeiro (Análise da Negociação da Manhã)

Em minha previsão da manhã, destaquei o nível de 1,0324 como um ponto de decisão crítico para a entrada no mercado. Vamos dar uma olhada no gráfico de 5 minutos

Miroslaw Bawulski 16:22 2025-01-15 UTC+2

EUR/USD: Plano de Negociação para a Sessão dos E.U.A. de 14 de janeiro (Revisão das Negociações da Manhã)

Na minha previsão da manhã, foquei no nível 1,0277 e planejei tomar decisões de negociação com base nele. Vamos dar uma olhada no gráfico de 5 minutos para

Miroslaw Bawulski 19:31 2025-01-14 UTC+2
Não pode falar agora?
Faça sua pergunta no chat.
Widget callback
 

Dear visitor,

Your IP address shows that you are currently located in the USA. If you are a resident of the United States, you are prohibited from using the services of InstaFintech Group including online trading, online transfers, deposit/withdrawal of funds, etc.

If you think you are seeing this message by mistake and your location is not the US, kindly proceed to the website. Otherwise, you must leave the website in order to comply with government restrictions.

Why does your IP address show your location as the USA?

  • - you are using a VPN provided by a hosting company based in the United States;
  • - your IP does not have proper WHOIS records;
  • - an error occurred in the WHOIS geolocation database.

Please confirm whether you are a US resident or not by clicking the relevant button below. If you choose the wrong option, being a US resident, you will not be able to open an account with InstaForex anyway.

We are sorry for any inconvenience caused by this message.