сила сигнала 3 из 5

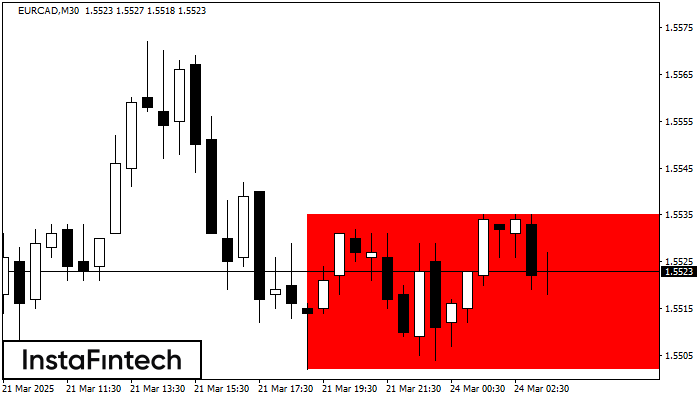
Сформирована фигура «Прямоугольник» на графике EURCAD M30. Тип фигуры: Продолжение тренда; Границы: Верхняя 1.5535, Нижняя 1.5502; Сигнал: позиция на продажу открывается после фиксации цены ниже границы прямоугольника 1.5502.
- Все
- Вымпел
- Голова и плечи
- Двойная вершина
- Прямоугольник
- Треугольник
- Тройная вершина
- Флаг
- Все
- #AAPL
- #AMZN
- #Bitcoin
- #EBAY
- #FB
- #GOOG
- #INTC
- #KO
- #MA
- #MCD
- #MSFT
- #NTDOY
- #PEP
- #TSLA
- #TWTR
- AUDCAD
- AUDCHF
- AUDJPY
- AUDUSD
- EURCAD
- EURCHF
- EURGBP
- EURJPY
- EURNZD
- EURRUB
- EURUSD
- GBPAUD
- GBPCHF
- GBPJPY
- GBPUSD
- GOLD
- NZDCAD
- NZDCHF
- NZDJPY
- NZDUSD
- SILVER
- USDCAD
- USDCHF
- USDJPY
- USDRUB
- Все
- M5
- M15
- M30
- H1
- D1
- Все
- Покупка
- Продажа
- Все
- 1
- 2
- 3
- 4
- 5
According to the chart of M5, GBPCHF formed the Bullish Symmetrical Triangle pattern. Description: This is the pattern of a trend continuation. 1.0893 and 1.0861 are the coordinates
The M5 and M15 time frames may have more false entry points.
Open chart in a new windowAccording to the chart of M5, NZDJPY formed the Bullish Rectangle. This type of a pattern indicates a trend continuation. It consists of two levels: resistance 84.40 and support 84.26
The M5 and M15 time frames may have more false entry points.
Open chart in a new windowAccording to the chart of M5, EURCHF formed the Bearish Symmetrical Triangle pattern. Trading recommendations: A breach of the lower border 0.9305 is likely to encourage a continuation
The M5 and M15 time frames may have more false entry points.
Open chart in a new window