empty
10.04.2023 06:41 AM
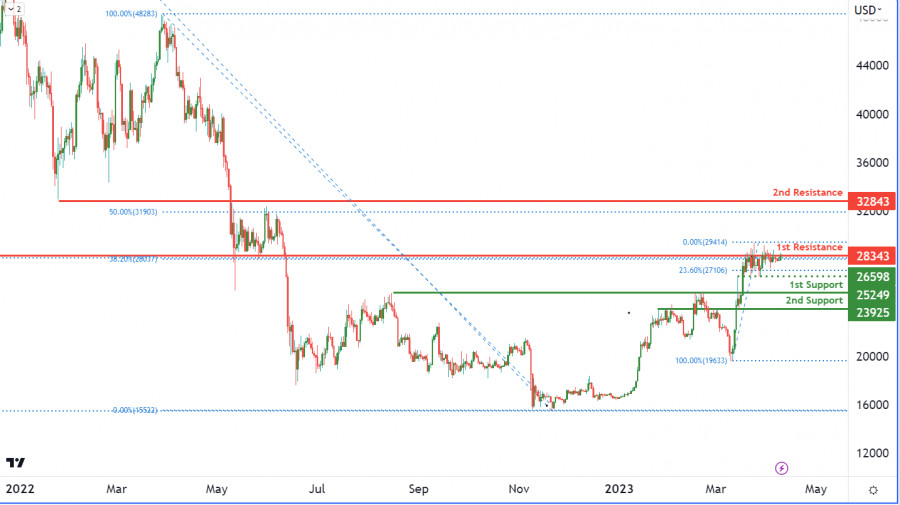
BTCUSD, Daily | Potential reversal from 1st resistance?

This image is no longer relevant

The BTC/USD chart currently reflects a bearish momentum in the cryptocurrency market, and Bitcoin seems to be following the trend. The chart suggests that the price of Bitcoin could face resistance at the 1st resistance level of 28343, which has previously been an important level as an overlap resistance. If Bitcoin fails to break through this level, it may result in a bearish reaction causing the price to drop towards the 1st support level of 25249. This level, being a pullback support, could act as a strong support for the price of Bitcoin.

In the event that the price of Bitcoin breaks through the 1st resistance level, the next resistance level it could face is the 2nd resistance level of 32843, which is a pullback resistance. Conversely, if Bitcoin breaks below the 1st support level, the next support level it could drop to is the 2nd support level of 23925. This level, also being a pullback support, could potentially act as a strong support for the price of Bitcoin.

Additionally, there is an intermediate support level at 26598, which is a swing low support and is accompanied by a 23.60% Fibonacci retracement. This level could potentially provide support to the price of Bitcoin if it drops towards the 1st support level. Overall, the BTC/USD chart's momentum is bearish, indicating that the price is expected to continue falling in the near term.

Seleccione el marco de tiempo
5
min
15
min
30
min
1
hora
4
horas
1
día
1
s.
Gana con los cambios en el valor de las criptomonedas con InstaForex.
Descarga MetaTrader 4 y abre tu primera operación.
  • Grand Choice
    Contest by
    InstaForex
    InstaForex always strives to help you
    fulfill your biggest dreams.
    UNIRSE AL CONCURSO

Recommended Stories

Bitcoin - análisis técnico de la situación

Viernes, y el Bitcoin sigue esperando. Ninguna de las partes enfrentadas tiene prisa por presentarse y ser activa. En la incertidumbre actual, el posicionamiento de los principales índices de referencia

Evangelos Poulakis 07:45 2025-02-14 UTC+2

Previsión para el gas natural (GN) del 5 de febrero de 2025

En el gráfico semanal la semana pasada el precio se revirtió desde el nivel de soporte 3.017 - desde los máximos de septiembre 2024, agosto 2023, febrero 2023 y también

Laurie Bailey 07:51 2025-02-05 UTC+2

#NDX - análisis técnico de la situación

A finales del año pasado, el índice marcó un nuevo máximo histórico (22141), tras lo cual se detuvo la subida, comenzó la formación de la corrección y la consolidación. Ahora

Evangelos Poulakis 07:24 2025-02-04 UTC+2

Bitcoin 30 Enero - análisis técnico de la situación

A pesar de marcar un nuevo máximo la semana pasada (109986), el Bitcoin detuvo su tendencia alcista y comenzó a formar incertidumbre. Hasta ahora, el formato semanal ha proyectado

Evangelos Poulakis 07:24 2025-01-30 UTC+2

#SPX (contrato CFD sobre futuros del SP500). Esperamos que la subida continúe

El contrato CFD sobre futuros del S&P 500 se recupera vigorosamente tras una caída local del lunes por la oleada de noticias sobre el éxito de la empresa china DeepSeek

Pati Gani 11:06 2025-01-29 UTC+2

Nasdaq 100. Se esperan nuevos máximos históricos

La toma de posesión hoy de Donald Trump marcará el inicio del segundo mandato de su presidencia, acompañado de promesas de reforzar la posición de EE. UU. en la escena

Anna Zotova 10:00 2025-01-20 UTC+2

Bitcoin – análisis técnico de la situación

El año pasado los principales logros y ventajas estuvieron del lado de los compradores. El año 2024 les trajo un nuevo máximo histórico (108362,36), superando el máximo anterior registrado

Evangelos Poulakis 06:55 2025-01-20 UTC+2

Análisis técnico para la semana del 16 al 21 de diciembre, del par de divisas GBP/USD.

La semana pasada, el par, moviéndose hacia abajo, rompió el nivel de retroceso del 14,6% – 1,2624 (línea de puntos azul), cerrando la vela semanal en 1,2618. Durante la próxima

Stefan Doll 09:17 2024-12-16 UTC+2

EUR/USD. 10 de diciembre. Los toros agotaron su potencial.

Buenos días, estimados traders. El par EUR/USD el lunes realizó un rebote desde el nivel de corrección del 323,6% – 1,0532, una ligera subida y un regreso al nivel 1,0532

Samir Klishi 11:31 2024-12-10 UTC+2

GBP/USD. 10 de diciembre. La libra está estancada y esperando la inflación estadounidense

Buenos días, estimados traders. En el marco temporal de una hora, el par GBP/USD el lunes volvió a la zona de resistencia 1,2788–1,2801, rebotó desde ella, giró a favor

Samir Klishi 11:31 2024-12-10 UTC+2
¿No puede hablar ahora mismo?
Ingrese su pregunta en el chat.
Widget callback
 

Dear visitor,

Your IP address shows that you are currently located in the USA. If you are a resident of the United States, you are prohibited from using the services of InstaFintech Group including online trading, online transfers, deposit/withdrawal of funds, etc.

If you think you are seeing this message by mistake and your location is not the US, kindly proceed to the website. Otherwise, you must leave the website in order to comply with government restrictions.

Why does your IP address show your location as the USA?

  • - you are using a VPN provided by a hosting company based in the United States;
  • - your IP does not have proper WHOIS records;
  • - an error occurred in the WHOIS geolocation database.

Please confirm whether you are a US resident or not by clicking the relevant button below. If you choose the wrong option, being a US resident, you will not be able to open an account with InstaForex anyway.

We are sorry for any inconvenience caused by this message.