empty
02.12.2019 12:56 PM
Trading recommendations for the GBPUSD currency pair - placement of trade orders (December 2)

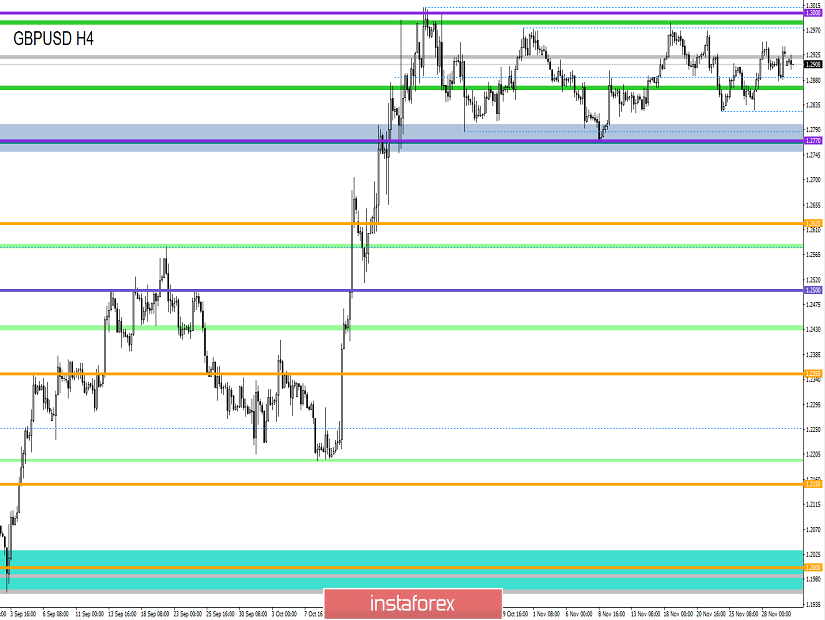
From the point of view of a comprehensive technical analysis, we see a bright V-shaped oscillation, where the previously set forecasts coincided 100%, as a result, a relatively small but still profitable. So, working at the phase of mining the resistance area of 1.2950 / 1.3000, the quotation managed to go down to a mirror level of 1.2885 [50% relative to the flat of 1.2770 / 1.3000], where the support was expectedly found. As a result, the quotation continued to oscillate in the upper part of the flat 1.2885 / 1.3000, having a rather impulsive upward move. What has changed, you ask, nothing, the quotation is still clamped within the flat and builds its swing relative to key levels of 1.2770 // 1.2880 // 1.3000.

In terms of volatility, unfortunately, we cannot distinguish any drastic changes, we are still below the average level, but at the same time, the emotional component of market participants, on the contrary, has changed significantly. So, pay attention to the structure of hourly candles, where for more than a week on a daily basis there are impulse moves, which is a good sign for the future acceleration of volatility.

As discussed in the previous review, many speculators worked downward from the 1.2950 / 1.3000 area, where the top-up in the position occurred at the moment of passing the 1.2898 mark, and transactions were fixed within the mirror level of 1.2885. I do not exclude the possibility that some traders also managed to work on the subsequent bounce from the mirror level.

Considering the trading chart in general terms, the daily period, we see the same flat formation of 1.2770 / 1.3000, lasting more than 6 weeks. Once again, we have confirmation that a characteristic uncertainty remains in the market, where market interest is growing on a weekly basis in the hope of an early breakdown of borders.

The news background of the past day contained data on lending in Britain, where the number of approved mortgage loans decreased from 65.80K to 64.60K, and the volume of consumer lending by the Bank of England, on the contrary, grew from 0.785B to 1.326.

Market reaction to statistical data was practically absent due to the preserving information background.

Analyzing the information flow, we see the terrible terrorist act in England that occurred on Friday and were against this background, Prime Minister Boris Johnson decided to further strengthen his position in the election race to the British Parliament. So, in the incident, he indirectly blamed the policy of the Labor Party, who introduced technical substantiation to the legislation, which allowed the early release of the terrorist.

In fact, all of Jeremy Corbyn's subsequent comments regarding the event no longer mattered, as Johnson indicated that, when he won, he would tighten prison sentences several times and would no longer allow that.

As for the pre-election race, another BMG poll took place last Saturday, which showed that the conservatives lost 2% of the vote and currently they have 39%. Labor, on the contrary, jumped 5% and currently, they have 33%.

In turn, the Federation of British Industry believes that the Brexit deal, which is supported by Boris Johnson, could help untie the hands of investments that have recently been leaving the country.

This image is no longer relevant

Today, in terms of the economic calendar, we had an index of business activity in the UK manufacturing sector, where we recorded a decrease from 49.6 to 48.6 with a forecast of 48.3. In the afternoon, similar PMI data will be released, but for the United States, where growth from 51.3 to 52.2 is expected.

Further development

Analyzing the current trading chart, we see that the night gap was closed in the morning, and the quotation continued its mixed movement, where the movement was conditionally horizontal. The actual recent gap plays the role of resistance, increasing the influx of short positions, and the breakdown of the minimum of the 1.2909 cluster was a certain starting point. In terms of volatility, there is a characteristic acceleration, but still within the average. In turn, speculative interest remains in the market, which may just give the dynamics of further acceleration.

Detailing every minute movement, we see that the first candlestick opened with a gap of 22 points, after which there was a narrow stagnation of 6 points, and at the time of the start of the Europeans the gap was closed, with acceleration from it.

In turn, speculators are counting on a further decline in quotations in the direction of the mirror level of 1.2885.

Having a general picture of actions, it is possible to assume that, relative to current points, special attention is paid to the value of 1.2909, since at this time it plays the role of a possible variable level. Thus, if it is possible to hold on and not fix higher than 1.2925, then a move to the mirror level of 1.2885 will be possible.

This image is no longer relevant

Based on the above information, we derive trading recommendations:

- Buy positions are considered in case of price-fixing higher than 1.2925.

- Sales positions are considered in case of price fixing below the area of 1.2909-1.2900
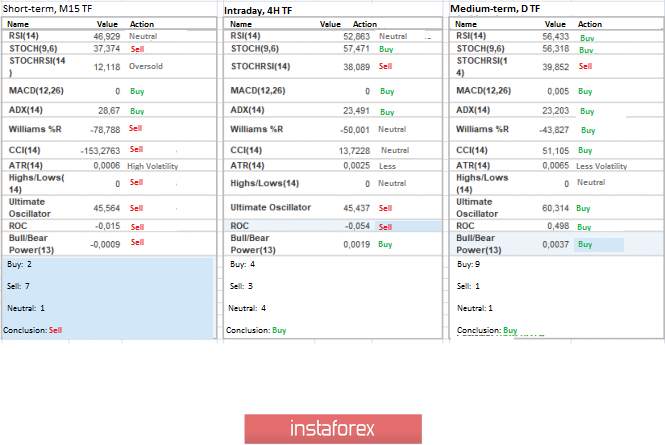
Indicator analysis

Analyzing a different sector of timeframes (TFs), we see that the indicator's are aimed at upward interest, due to the fact that the quote remains at the top of the flat formation. If the quotation still manages to return to the limits of the mirror level, then the interests in terms of intraday consideration may change.

This image is no longer relevant

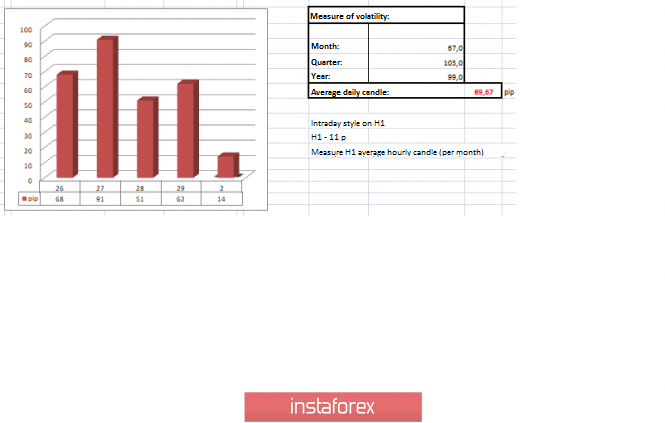
Volatility per week / Measurement of volatility: Month; Quarter Year

Measurement of volatility reflects the average daily fluctuation, calculated for the Month / Quarter / Year.

(December 2 was built taking into account the time of publication of the article)

The volatility of the current time is 14 points, which is still an extremely low value for this time section. It is likely to assume that acceleration of volatility is still possible in the case of strengthening and moving to the area of the mirror level.

This image is no longer relevant

Key levels

Resistance Zones: 1.3000; 1.3170 **; 1.3300 **.

Support Areas: 1.2885 *; 1.2770 **; 1.2700 *; 1.2620; 1.2580 *; 1.2500 **; 1.2350 **; 1.2205 (+/- 10p.) *; 1.2150 **; 1,2000 ***; 1.1700; 1.1475 **.

* Periodic level

** Range Level

*** The article is built on the principle of conducting a transaction, with daily adjustment

เลือกช่วงเวลา
5
นาที
15
นาที
30
นาที
1
ชั่วโมง
4
ชั่วโมง
1
วัน
1
สัปดาห์
รับผลกำไรจากการเปลี่ยนแปลงอัตราสกุลเงินดิจิทัลกับ InstaForex.
ดาวน์โหลด MetaTrader 4 และเปิดการซื้อขายครั้งแรกของคุณ.
  • Grand Choice
    Contest by
    InstaForex
    InstaForex always strives to help you
    fulfill your biggest dreams.
    เข้าร่วมการแข่งขัน


บทความแนะนำ

การพยากรณ์ตลาด Forex วันที่ 28/04/2025: EUR/USD, GBP/USD, USD/JPY, USDX, ทองคำ และ Bitcoin

ลิงก์ที่เป็นประโยชน์: สามารถอ่านบทความอื่น ๆ ของฉันได้ในส่วนนี้ หลักสูตร InstaForex สำหรับผู้เริ่มต้น การวิเคราะห์ที่ได้รับความนิยม เปิดบัญชีซื้อขาย ข้อควรระวัง: นักเทรดฟอเร็กซ์มือใหม่ต้องระมัดระวังอย่างมากเมื่อทำการตัดสินใจเข้าตลาด ก่อนการประกาศรายงานสำคัญ แนะนำให้หลีกเลี่ยงการเข้าเทรดในตลาดเพื่อหลีกเลี่ยงความผันผวนที่เกิดขึ้นจากตลาดที่มีความผันผวนสูง หากคุณตัดสินใจที่จะเทรดในระหว่างการประกาศข่าว ควรวางคำสั่งหยุดขาดทุนเสมอเพื่อจำกัดการสูญเสีย

Sebastian Seliga 18:34 2025-04-28 UTC+2

สัญญาณการเทรดสำหรับ EUR/USD สำหรับวันที่ 28-30 เมษายน 2025: ขายต่ำกว่า 1.1370 (21 SMA - 7/8 Murray)

ในช่วงเช้าของการซื้อขายในสหรัฐอเมริกา ยูโรซื้อขายอยู่ที่ประมาณ 1.1349 ในแชนแนลของแนวโน้มที่ลดลงซึ่งก่อตั้งขึ้นเมื่อวันที่ 18 เมษายน EUR/USD มีการรวมตัวกันในช่วงไม่กี่วันที่ผ่านมาอยู่ที่ประมาณ 1.1340 หากคู่ EUR/USD ทะลุและรวมตัวที่เหนือแชนแนลของแนวโน้มที่ลดลง และที่ระดับสูงกว่า 21SMA ที่ตั้งอยู่ที่

Dimitrios Zappas 16:29 2025-04-28 UTC+2

สัญญาณการซื้อขายสำหรับทองคำ (XAU/USD) วันที่ 28-30 เมษายน 2025: ซื้อเหนือระดับ $3,270 (21 SMA - 7/8 Murray)

ในช่วงต้นของการซื้อขายในฝั่งอเมริกา ราคาทองคำเคลื่อนไหวอยู่ราว ๆ 3,299 ภายในช่องแนวโน้มที่ลดลงซึ่งเริ่มก่อตัวตั้งแต่วันที่ 21 เมษายน แสดงถึงการฟื้นตัวเหนือแนวรับที่ 3,270 ที่กราฟ H4 เราสามารถเห็นการรวมตัวของราคา $100 จาก 3,370

Dimitrios Zappas 16:25 2025-04-28 UTC+2

บทวิเคราะห์ทางเทคนิค – GOLD

เมื่อสัปดาห์ที่แล้ว ฝ่ายซื้อได้ปรับค่าจุดสูงสุดทางประวัติศาสตร์และสร้างค่าจุดสุดขีดใหม่ที่ 3499.58 หลังจากนั้น ทองคำได้เข้าสู่การปรับฐานลงไปในแนวสนับสนุนของแนวโน้มระยะสั้นประจำวันที่ 3346.45 ตลาดได้หยุดชะงัก หากความรู้สึกของฝ่ายขายได้รับแรงกระตุ้นใหม่เพื่อพัฒนาต่อไป เป้าหมายถัดไปจะเป็นแนวโน้มระยะกลางประจำวันที่ 3227.79 และการปรับฐานลงอาจขยายไปยังแนวสนับสนุนของแนวโน้มระยะสั้นรายสัปดาห์ที่ 3164.81 การกำจัดจุดไขว้สีทองประจำวันที่ 3163.64 และการยืนต่ำกว่าแนวรายสัปดาห์ที่

Evangelos Poulakis 06:49 2025-04-28 UTC+2

USD/JPY – สรุปและแนวโน้ม

สัปดาห์ที่แล้ว ตลาดได้ปรับปรุงระดับต่ำสุดใหม่ แต่ผู้ขายไม่สามารถทำให้การเคลื่อนไหวลงต่อไปได้อย่างเต็มที่ อาจเป็นเพราะระดับต่ำสุดของสัปดาห์ก่อนหน้านี้ (141.63) ได้รับการสนับสนุนเพิ่มเติมจากระดับสนับสนุนรายเดือน (141.96) ส่งผลให้การลดลงหยุดชะงัก และคู่สกุลเงินนี้เริ่มมีการปรับตัวขึ้น ในการปรับตัวขึ้นนี้ ฝ่ายซื้อสามารถกลับมาเรียกคืนการสนับสนุนจากแนวโน้มระยะสั้นในกรอบรายวัน ซึ่งปัจจุบันตั้งอยู่ที่ 141.97 และยังคงดันราคาขึ้นเรื่อยๆ เป้าหมายที่ใกล้ในตอนนี้

Evangelos Poulakis 03:51 2025-04-28 UTC+2

สัญญาณการซื้อขายสำหรับทองคำ (XAU/USD) ระหว่างวันที่ 25-29 เมษายน 2025: ซื้อเมื่อราคาเหนือ $3,270 (เด้งรับจากเส้นค่าเฉลี่ยเคลื่อนที่ 21 วัน)

ในช่วงต้นของเซสชันอเมริกา ราคาทองคำอยู่ที่ประมาณ 3,276 โดยมีแรงกดดันจากแรงขาย หลังจากพบแนวต้านอย่างมากที่ประมาณ 3,270 ซึ่งเป็นระดับที่ตรงกับการปรับฐาน Fibonacci ที่ 38.2% ทองคำอาจกำลังถึงระดับแนวรับ โดยมีการคาดการณ์ว่าจะมีการทรงตัวในอีกไม่กี่ชั่วโมงข้างหน้า ทองคำกำลังซื้อขายในโซนการรีบาวด์ทางเทคนิค ขณะนี้ Eagle

Dimitrios Zappas 18:02 2025-04-25 UTC+2

คาดการณ์ Forex วันที่ 25/04/2025: EUR/USD, GBP/USD, USD/JPY และ Bitcoin

ลิงก์ที่มีประโยชน์: บทความอื่นๆ ของฉันมีอยู่ในส่วนนี้ คอร์ส InstaForex สำหรับผู้เริ่มต้น การวิเคราะห์ยอดนิยม เปิดบัญชีซื้อขาย สำคัญ: ผู้เริ่มต้นในการซื้อขายฟอเร็กซ์ควรระมัดระวังอย่างยิ่งเมื่อตัดสินใจเกี่ยวกับการเข้าสู่ตลาด ก่อนที่จะมีการเปิดเผยรายงานสำคัญ ขอแนะนำให้อยู่ห่างจากตลาดเพื่อหลีกเลี่ยงความผันผวนที่เกิดขึ้นอย่างรวดเร็วจากการเปลี่ยนแปลงการเคลื่อนไหวราคา ถ้าคุณตัดสินใจที่จะซื้อขายในช่วงเวลาที่มีการเผยแพร่ข่าว ควรวางคำสั่งหยุดการขาดทุนเสมอเพื่อจำกัดการสูญเสียให้มีความเสี่ยงน้อยที่สุด หากไม่ได้วางคำสั่งหยุดการขาดทุน

Sebastian Seliga 12:25 2025-04-25 UTC+2

สัญญาณการเทรดสำหรับ EUR/USD ในวันที่ 24-26 เมษายน 2025: ขายต่ำกว่า 1.1435 (21 SMA - 7/8 Murray)

ในช่วงต้นของเซสชั่นอเมริกา คู่สกุลเงิน EUR/USD กำลังซื้อขายอยู่ที่ระดับ 1.1358 ภายในช่องแนวโน้มขาลงที่เริ่มเมื่อวันที่ 18 เมษายน คู่สกุลเงินนี้ยังถูกกดดันจากแรงขาย เราเชื่อว่าเครื่องมือการเงินนี้ยังมีทางลงอีกยาวไกลกว่าจะถึงก้นของช่องแนวโน้มขาลง ยูโรคาดว่าจะฟื้นตัวในชั่วโมงต่อๆ ไป และขึ้นไปถึงระดับ 1.1429 บนกราฟ

Dimitrios Zappas 17:06 2025-04-24 UTC+2

การพยากรณ์ Forex วันที่ 24/04/2025: EUR/USD, GBP/USD, SP500, ทองคำ และ Bitcoin

ลิงก์ที่มีประโยชน์: บทความอื่นๆ ของฉันสามารถอ่านได้ในส่วนนี้ คอร์ส InstaForex สำหรับผู้เริ่มต้น การวิเคราะห์ยอดนิยม เปิดบัญชีซื้อขาย สำคัญ: นักลงทุนมือใหม่ในตลาดฟอเร็กซ์จำเป็นต้องระมัดระวังอย่างมากเมื่อตัดสินใจเข้าตลาด ก่อนการเปิดเผยรายงานสำคัญควรหลีกเลี่ยงการเข้าไปในตลาดเพื่อหลบเลี่ยงความผันผวนที่รุนแรง อันเนื่องมาจากความผันแปรที่เพิ่มขึ้น หากคุณตัดสินใจที่จะเทรดในช่วงที่มีการเผยแพร่ข่าวสาร ควรตั้งคำสั่งหยุดขาดทุนเสมอเพื่อช่วยลดความเสี่ยงในการขาดทุน หากไม่มีการตั้งคำสั่งหยุดขาดทุน

Sebastian Seliga 13:25 2025-04-24 UTC+2

ทองคำ: ราคาอาจลดลงอย่างมากในอนาคตอันใกล้นี้

ราคาทองคำได้ปรับตัวลดลงอย่างชัดเจนเมื่อเร็วๆ นี้ ท่ามกลางความคาดหวังในตลาดเกี่ยวกับการเริ่มต้นการเจรจาจริงระหว่างสหรัฐฯ และจีน เรื่องภาษีและการค้าภาพรวม คำแถลงของรัฐมนตรีคลัง S. Bessent ที่กล่าวว่าการทำสงครามภาษีในปัจจุบันระหว่างปักกิ่งและวอชิงตันไม่มีประโยชน์ บ่งบอกว่าการเจรจากำลังเกิดขึ้นเบื้องหลัง และอาจมีการบรรลุข้อตกลงในอนาคตอันใกล้นี้ ในทางเทคนิค ราคาของ "โลหะสีเหลือง" มีการกลับตัวลงในท้องถิ่น

Pati Gani 09:38 2025-04-24 UTC+2
หากไม่สะดวกคุยในตอนนี้
ระบุคำถามไว้ได้ใน แชท.
Widget callback
 

Dear visitor,

Your IP address shows that you are currently located in the USA. If you are a resident of the United States, you are prohibited from using the services of InstaFintech Group including online trading, online transfers, deposit/withdrawal of funds, etc.

If you think you are seeing this message by mistake and your location is not the US, kindly proceed to the website. Otherwise, you must leave the website in order to comply with government restrictions.

Why does your IP address show your location as the USA?

  • - you are using a VPN provided by a hosting company based in the United States;
  • - your IP does not have proper WHOIS records;
  • - an error occurred in the WHOIS geolocation database.

Please confirm whether you are a US resident or not by clicking the relevant button below. If you choose the wrong option, being a US resident, you will not be able to open an account with InstaForex anyway.

We are sorry for any inconvenience caused by this message.