empty
10.04.2023 06:41 AM
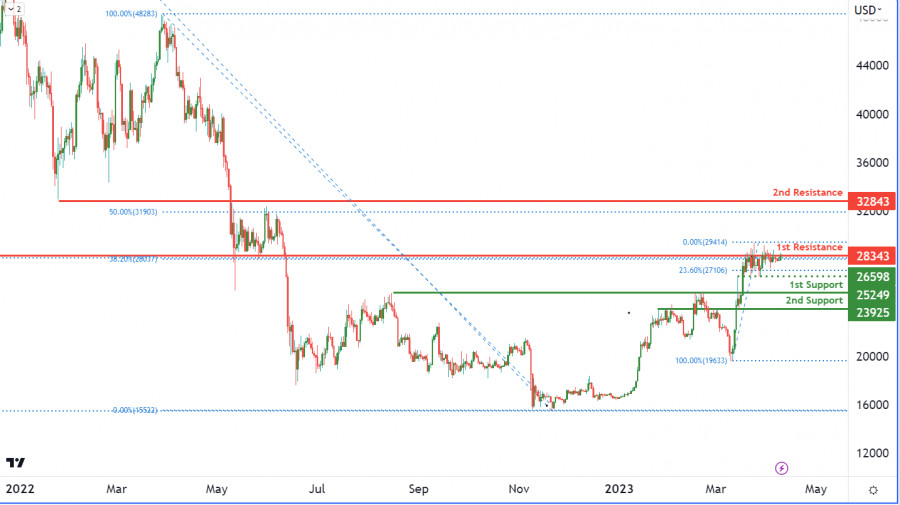
BTCUSD, Daily | Potential reversal from 1st resistance?

This image is no longer relevant

The BTC/USD chart currently reflects a bearish momentum in the cryptocurrency market, and Bitcoin seems to be following the trend. The chart suggests that the price of Bitcoin could face resistance at the 1st resistance level of 28343, which has previously been an important level as an overlap resistance. If Bitcoin fails to break through this level, it may result in a bearish reaction causing the price to drop towards the 1st support level of 25249. This level, being a pullback support, could act as a strong support for the price of Bitcoin.

In the event that the price of Bitcoin breaks through the 1st resistance level, the next resistance level it could face is the 2nd resistance level of 32843, which is a pullback resistance. Conversely, if Bitcoin breaks below the 1st support level, the next support level it could drop to is the 2nd support level of 23925. This level, also being a pullback support, could potentially act as a strong support for the price of Bitcoin.

Additionally, there is an intermediate support level at 26598, which is a swing low support and is accompanied by a 23.60% Fibonacci retracement. This level could potentially provide support to the price of Bitcoin if it drops towards the 1st support level. Overall, the BTC/USD chart's momentum is bearish, indicating that the price is expected to continue falling in the near term.

Chọn khung thời gian
5
phút
15
phút
30
phút
1
giờ
4
ngày
1
ngày
1
tuần
Kiếm lợi nhuận từ những biến đổi giá của tiền điện tử với InstaForex.
Tải MetaTrader 4 và mở giao dịch đầu tiên của bạn.
  • Grand Choice
    Contest by
    InstaForex
    InstaForex always strives to help you
    fulfill your biggest dreams.
    THAM GIA CUỘC THI

Các bài báo được đề xuất

EUR/USD – Ngày 17 tháng 2. Các Nhà Giao Dịch Đang Do Dự Vào Đầu Tuần Mới

Vào thứ Sáu, cặp EUR/USD đã củng cố trên mức thoái lui Fibonacci 76.4% tại 1.0458, tiếp tục xu hướng tăng lên mức thoái lui tiếp theo tại 1.0533

Samir Klishi 12:39 2025-02-17 UTC+2

GBP/USD – Ngày 17 tháng 2. Đồng Bảng Anh Đã Đạt Đỉnh?

Trên biểu đồ giờ, GBP/USD tiếp tục xu hướng tăng vào thứ Sáu, đóng cửa gần vùng kháng cự 1.2611–1.2620. Sự từ chối từ vùng

Samir Klishi 12:34 2025-02-17 UTC+2

Dự báo Forex ngày 17/02/2025: EUR/USD, USD/JPY, GBP/USD và Bitcoin

Liên kết hữu ích: Những bài viết khác của tôi có sẵn trong mục này Khóa học InstaForex dành cho người mới bắt đầu Phân Tích Phổ Biến

Sebastian Seliga 10:40 2025-02-17 UTC+2

Phân Tích Kỹ Thuật Chuyển Động Giá Trong Ngày của Các Cặp Tiền Tệ Chéo CAD/JPY, Thứ Hai ngày 17 tháng 2 năm 2025.

Với sự xuất hiện của mô hình Bullish Divergence, có vẻ như CAD/JPY trên biểu đồ 30 phút có tiềm năng tăng cường miễn là không

Arief Makmur 08:18 2025-02-17 UTC+2

Phân Tích Kỹ Thuật Chuyển Động Giá Trong Ngày của Cặp Tiền Tệ Chéo GBP/CHF, Thứ Hai Ngày 17 Tháng 2, Năm 2025.

Qua những gì chúng tôi quan sát trên biểu đồ 4 giờ, cặp tiền tệ chéo GBP/CHF dường như đang di chuyển trong kênh Pitchfork tăng giá, đặc biệt được

Arief Makmur 08:18 2025-02-17 UTC+2

BCH/USD – Kết Quả và Triển Vọng Hàng Tuần

Mức hỗ trợ cuối cùng của đường giao cắt Ichimoku hàng tháng ở mức 329,98 đã được đạt đến. Thị trường đã tạm dừng vào tuần trước và vẫn chịu

Evangelos Poulakis 05:29 2025-02-17 UTC+2

EUR/USD và GBP/USD – Phân Tích Kỹ Thuật

Những nhà đầu tư giá lên đã kịp phục hồi được phần lớn những tổn thất trước đây, đóng cửa trên xu hướng tuần ngắn hạn ở mức 1.0357

Evangelos Poulakis 23:21 2025-02-16 UTC+2

#NDX – Tóm tắt và Triển vọng hàng tuần

Tuần giao dịch vừa qua đã cho thấy một xu hướng tăng rõ rệt. Người mua đang tập trung vào việc hoàn tất điều chỉnh giảm và khôi phục

Evangelos Poulakis 23:21 2025-02-16 UTC+2

Tín hiệu giao dịch cho BITCOIN (BTC/USD) từ ngày 14-17 tháng 2, 2025: mua trên $96,569 (21 SMA - 3/8 Murray)

Ngược lại, nếu giá Bitcoin giảm xuống dưới $96,000, chu kỳ giảm giá dự kiến sẽ tiếp tục. Vì vậy, nó có thể giảm xuống mức 2/8 của Murray

Dimitrios Zappas 15:42 2025-02-14 UTC+2

Tín hiệu giao dịch cho EUR/USD từ ngày 14-17 tháng 2, 2025: bán dưới mức 1.0500 (200 EMA - 6/8 Murray)

Chỉ báo eagle đang đạt đến mức quá mua và cho thấy tín hiệu tiêu cực. Do đó, kế hoạch giao dịch của chúng

Dimitrios Zappas 15:21 2025-02-14 UTC+2
Không thể nói chuyện ngay bây giờ?
Đặt câu hỏi của bạn trong phần trò chuyện.
Widget callback
 

Dear visitor,

Your IP address shows that you are currently located in the USA. If you are a resident of the United States, you are prohibited from using the services of InstaFintech Group including online trading, online transfers, deposit/withdrawal of funds, etc.

If you think you are seeing this message by mistake and your location is not the US, kindly proceed to the website. Otherwise, you must leave the website in order to comply with government restrictions.

Why does your IP address show your location as the USA?

  • - you are using a VPN provided by a hosting company based in the United States;
  • - your IP does not have proper WHOIS records;
  • - an error occurred in the WHOIS geolocation database.

Please confirm whether you are a US resident or not by clicking the relevant button below. If you choose the wrong option, being a US resident, you will not be able to open an account with InstaForex anyway.

We are sorry for any inconvenience caused by this message.